Since launching our Sovereign ESG Data Portal (BETA) back in 2019, the ESG investing space has grown by leaps and bounds. ESG has become such a central point of discussion that it's hard to find a financial newspaper that doesn't feature an article about climate, sustainability or green finance on its front page.
 The new (left) and the previous (right) Sovereign ESG Data Portal.
More data = better data?
The continued rise in sustainable investing and climate finance was probably only matched by the continued demand for more and better data. However, the data supply has not grown on the same scale, especially for sovereign ESG data. This is not entirely surprising for two reasons: First, sovereign ESG and development indicators are closely intertwined, and the latter is certainly not a new topic. The World Bank's World Development Indicators (WDI) started in April 1989 and has grown over the past three decades to encompass more than 1,400 indicators. Second, except for geospatial data sources, the sovereign-level data ecosystem mainly relies on national statistical offices for the raw data. Their capacities did grow over the past three years, as the Statistical Performance Indicators show, but at orders of magnitudes slower than the demand for ESG data.
But is it really necessary to gather more and more data? The Sovereign ESG Data Portal (BETA) framework was built based on market surveys and expert consultations. It consisted of three pillars, 17 groups, and 67 indicators, which were hand-picked from the wider WDI database. This framework has enjoyed wide adoption in the industry and is one of the most used datasets for sovereign ESG.
What's new in the new portal?
When we engaged with data users, the feedback we received was not on the framework itself. Instead, we identified two main areas for improvement: Closing data gaps and guidance on how to use the data. Some of these are addressed in this relaunch, others will be tackled shortly.
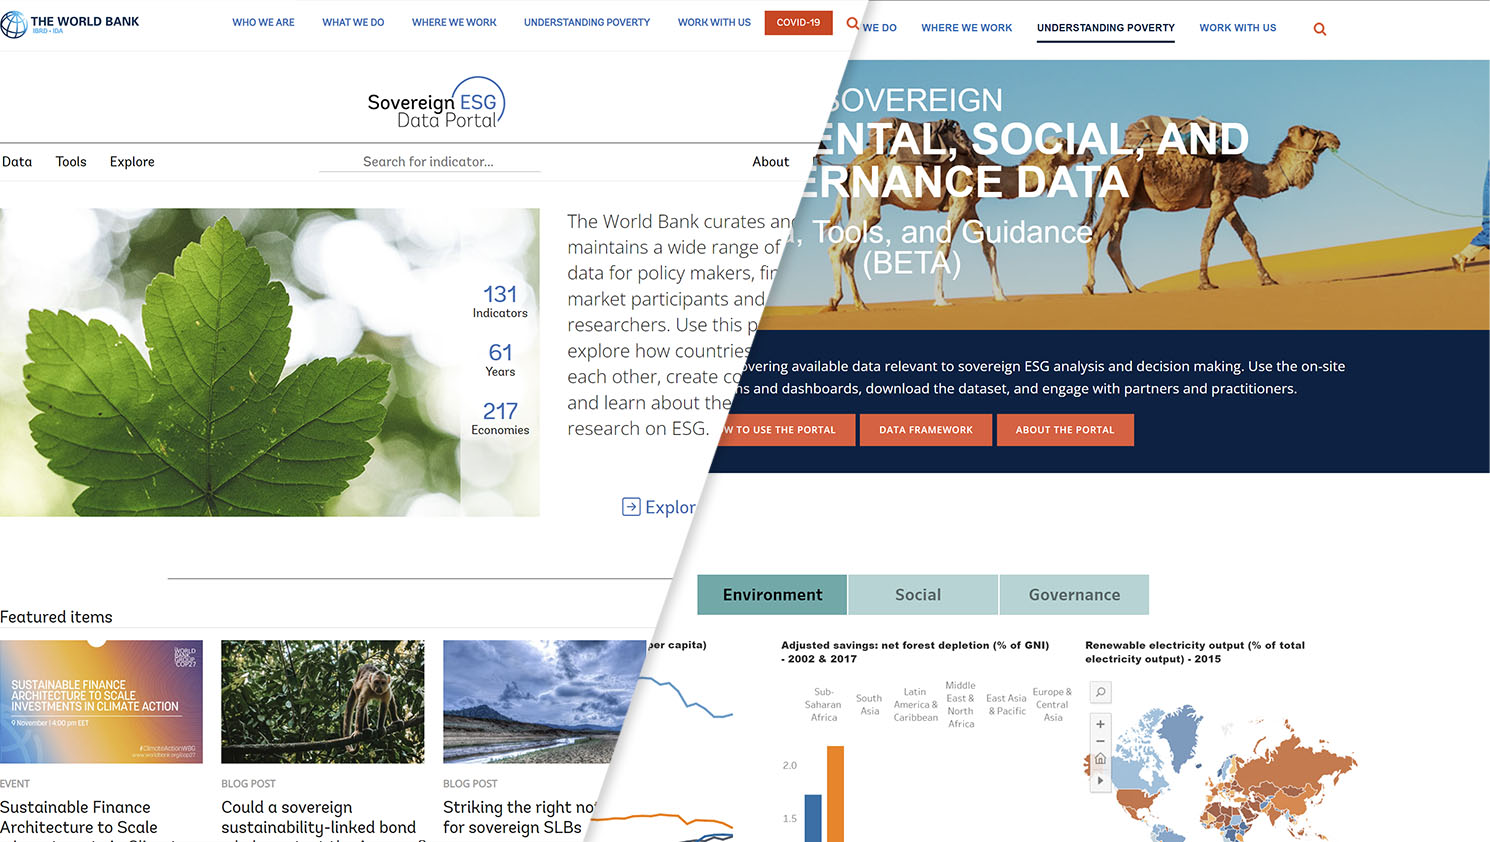
After opening the link to this portal, you probably noticed that it has an entirely new design and layout, along with new data and new tools. In total, the portal now covers 71 ESG indicators with 40 additional indicators over 61 years and across 217 economies. In this new portal we differentiate between ESG and additional indicators. The ESG indicators form the ESG framework while the additional indicators, which include GDP, inflation, surface areas and other key statistics, wealth data and financial development indicators (coming soon), are included into the portal as they give context to the ESG indicators but are not part of the ESG framework themselves.
New datasets for Environment, Governance and Wealth
New data: Better environmental indicators with geospatial sources.
If you head to our , you find the indicators by pillar and groups, along with the coverage on the right side. We replaced and discarded some indicators from the earlier framework and added 8 new data series to the Environmental/climate risk & resilience and Natural capital endowment and management groups.
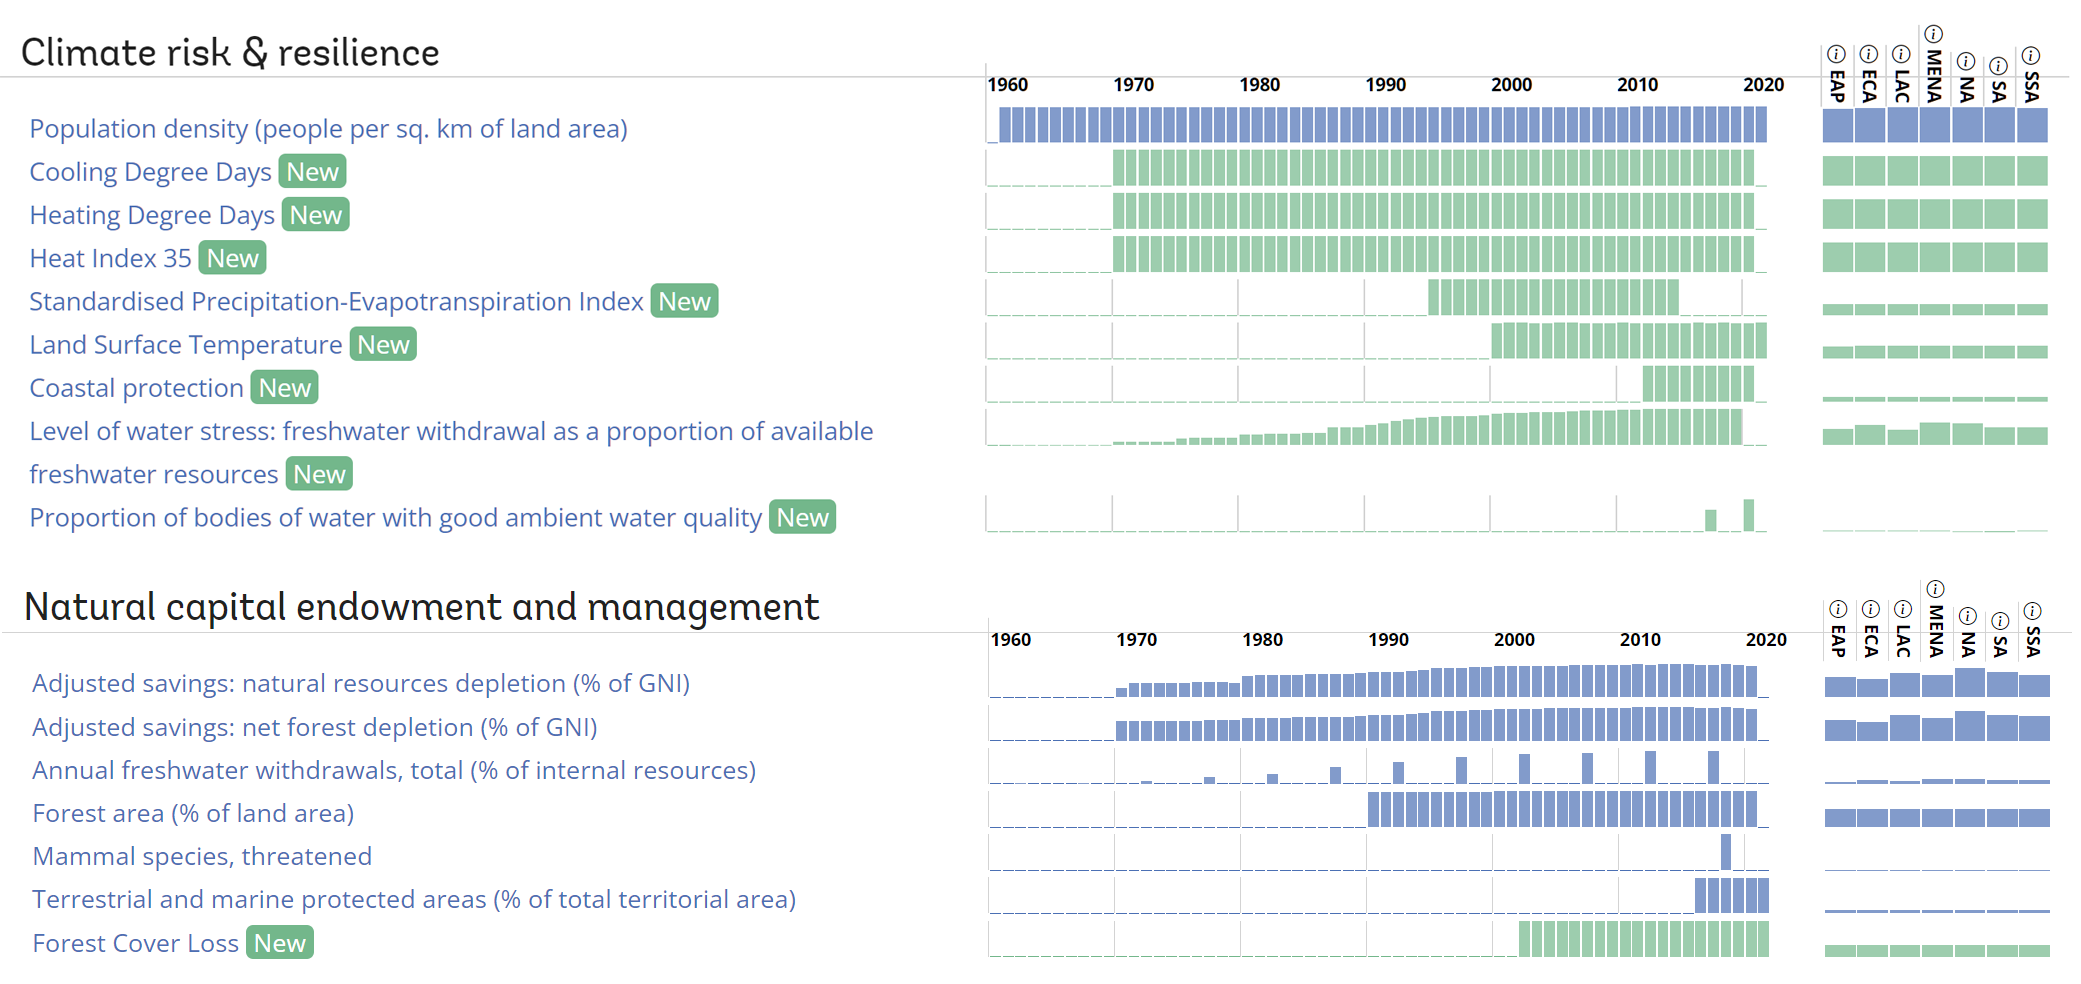 Green indicators are new additions to the Environment pillar.
New data: Economic and Social Rights
The Human Rights group under the Governance pillar was expanded with the "Social and Economic Rights Fulfillment Index". In the upcoming publication with the Human Rights Measurement Initiative (HRMI) we discuss how this indicator addresses the ingrained income bias using the Achievement Possibilities Frontier.
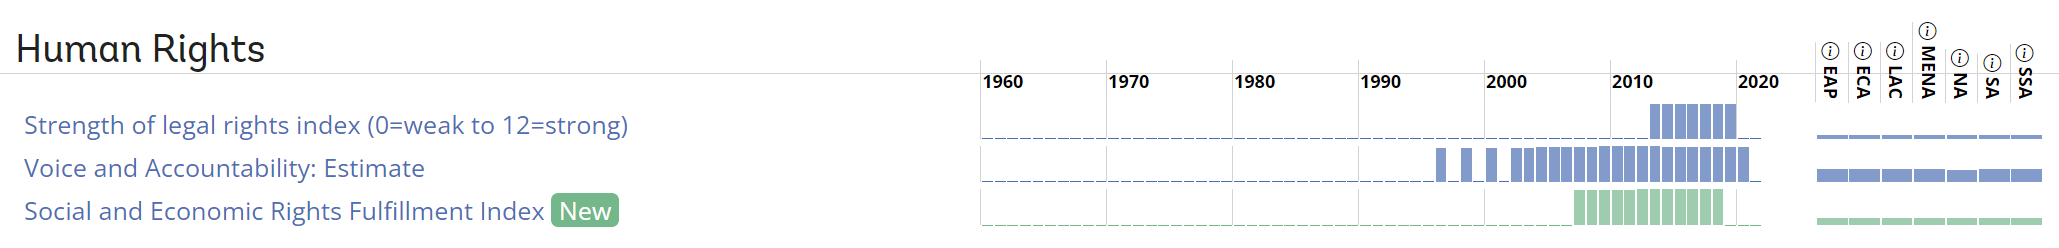 Green indicators are new additions to the Governance pillar.
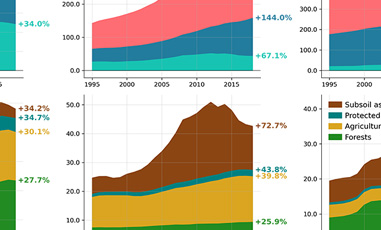
New data: Wealth accounting
The Changing Wealth of Nations 2021 provides an updated database and rich analysis of the world's wealth accounts spanning 146 countries, annually from 1995 to 2018. It contains the widest set of assets covered so far, including human capital broken down by gender and many different forms of natural capital, spanning minerals, fossil fuels, forests, mangroves, marine fisheries, and more.
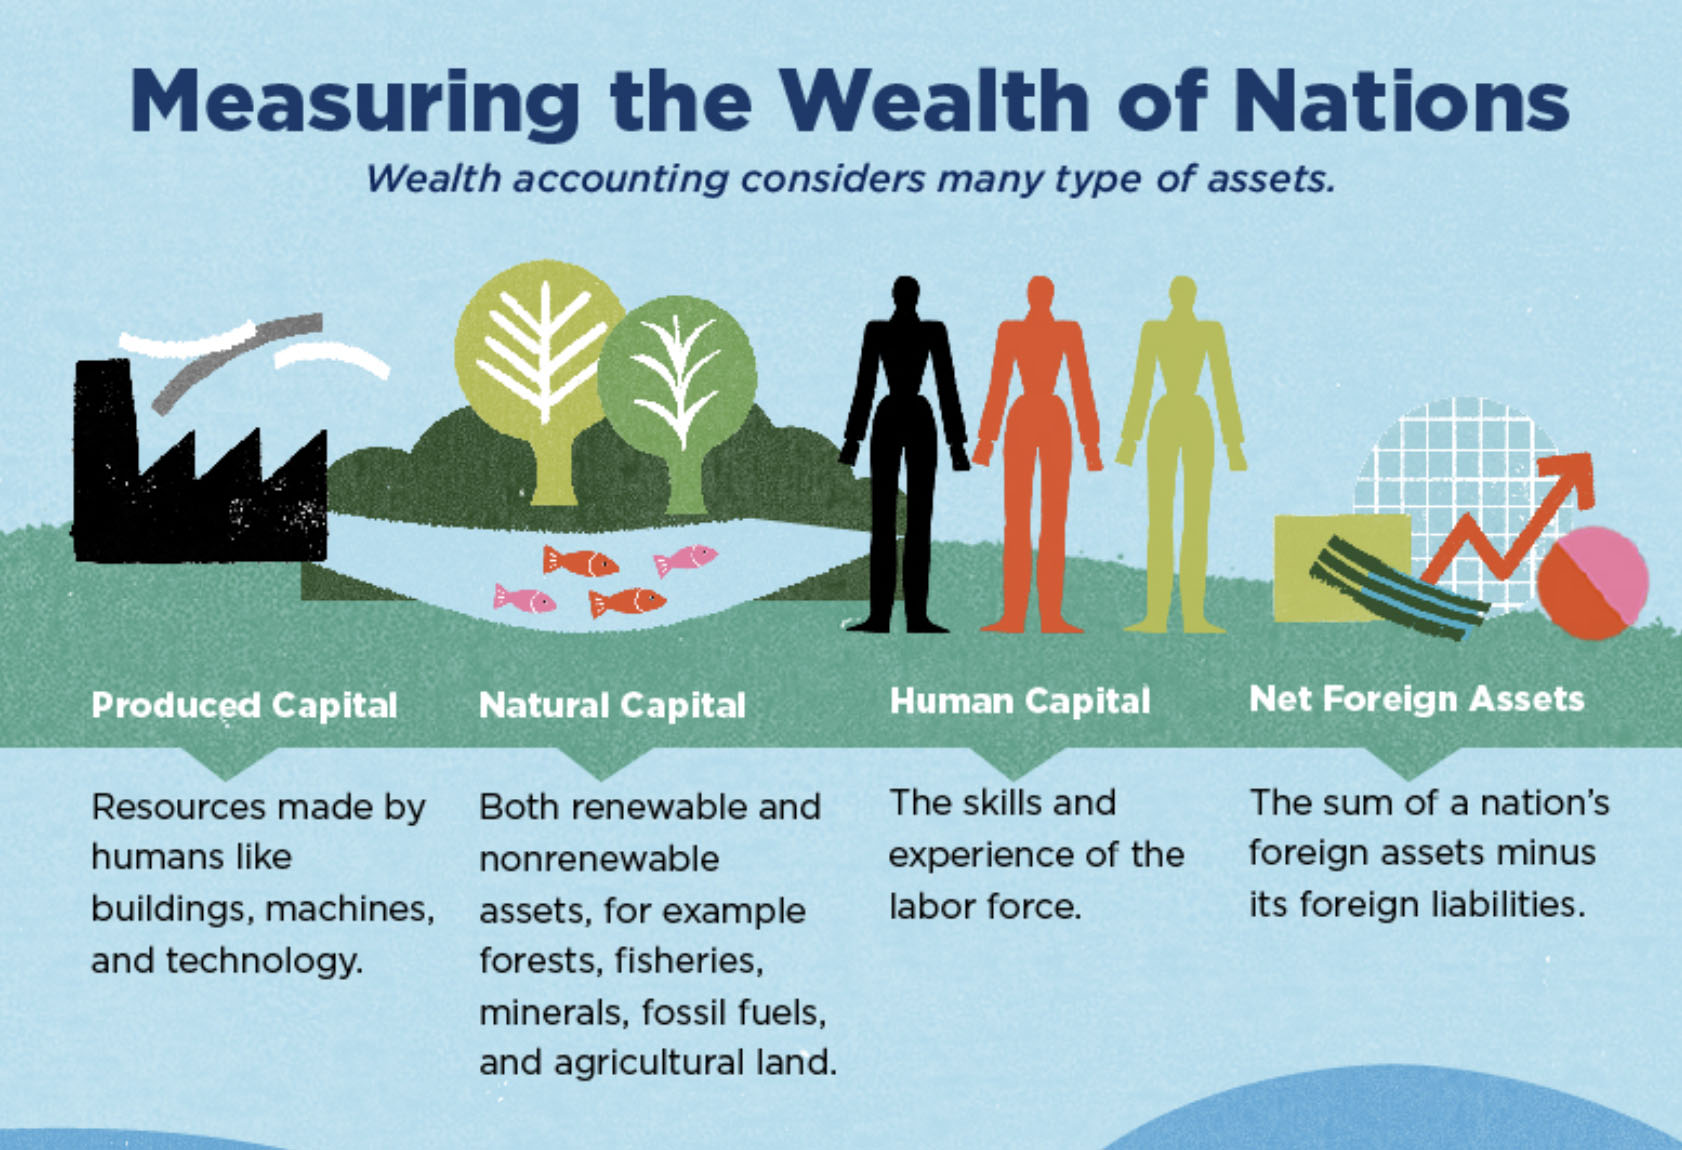 Wealth accounting consists of four components.
Understanding the data with new tools
New tool: Land cover transitions
A country's land cover composition is a helpful starting point for understanding its environmental profile. But the composition itself is often only part of the story. More interesting is often how the land cover changed. In the case of deforestation, for example, we would be interested in the current land cover and how it has changed recently. Did the rate of deforestation decrease? Or did reforest programs successfully expand forest cover?
This new tool, which uses data from global land cover maps at 300 m spatial resolution from the European Space Agency's Climate Change Initiative Land Cover project, goes one step further and answers: From which type and into which type of land cover did the country transition into?
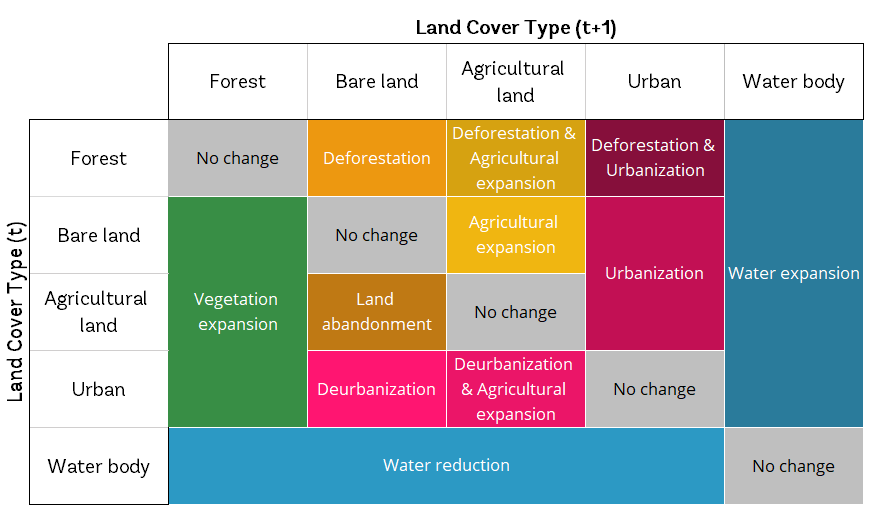 Snapshot of how tree cover transitioned into other land cover types between 2016-2017 in Colombia. Explore this picture
New tool: Indicators over time
To understand an ESG indicator, we need context. How did the indicator develop over time? How did countries from the same region develop? What about countries in the same income category? On the you can search and select the indicator of your interest and visualize its changes over time.
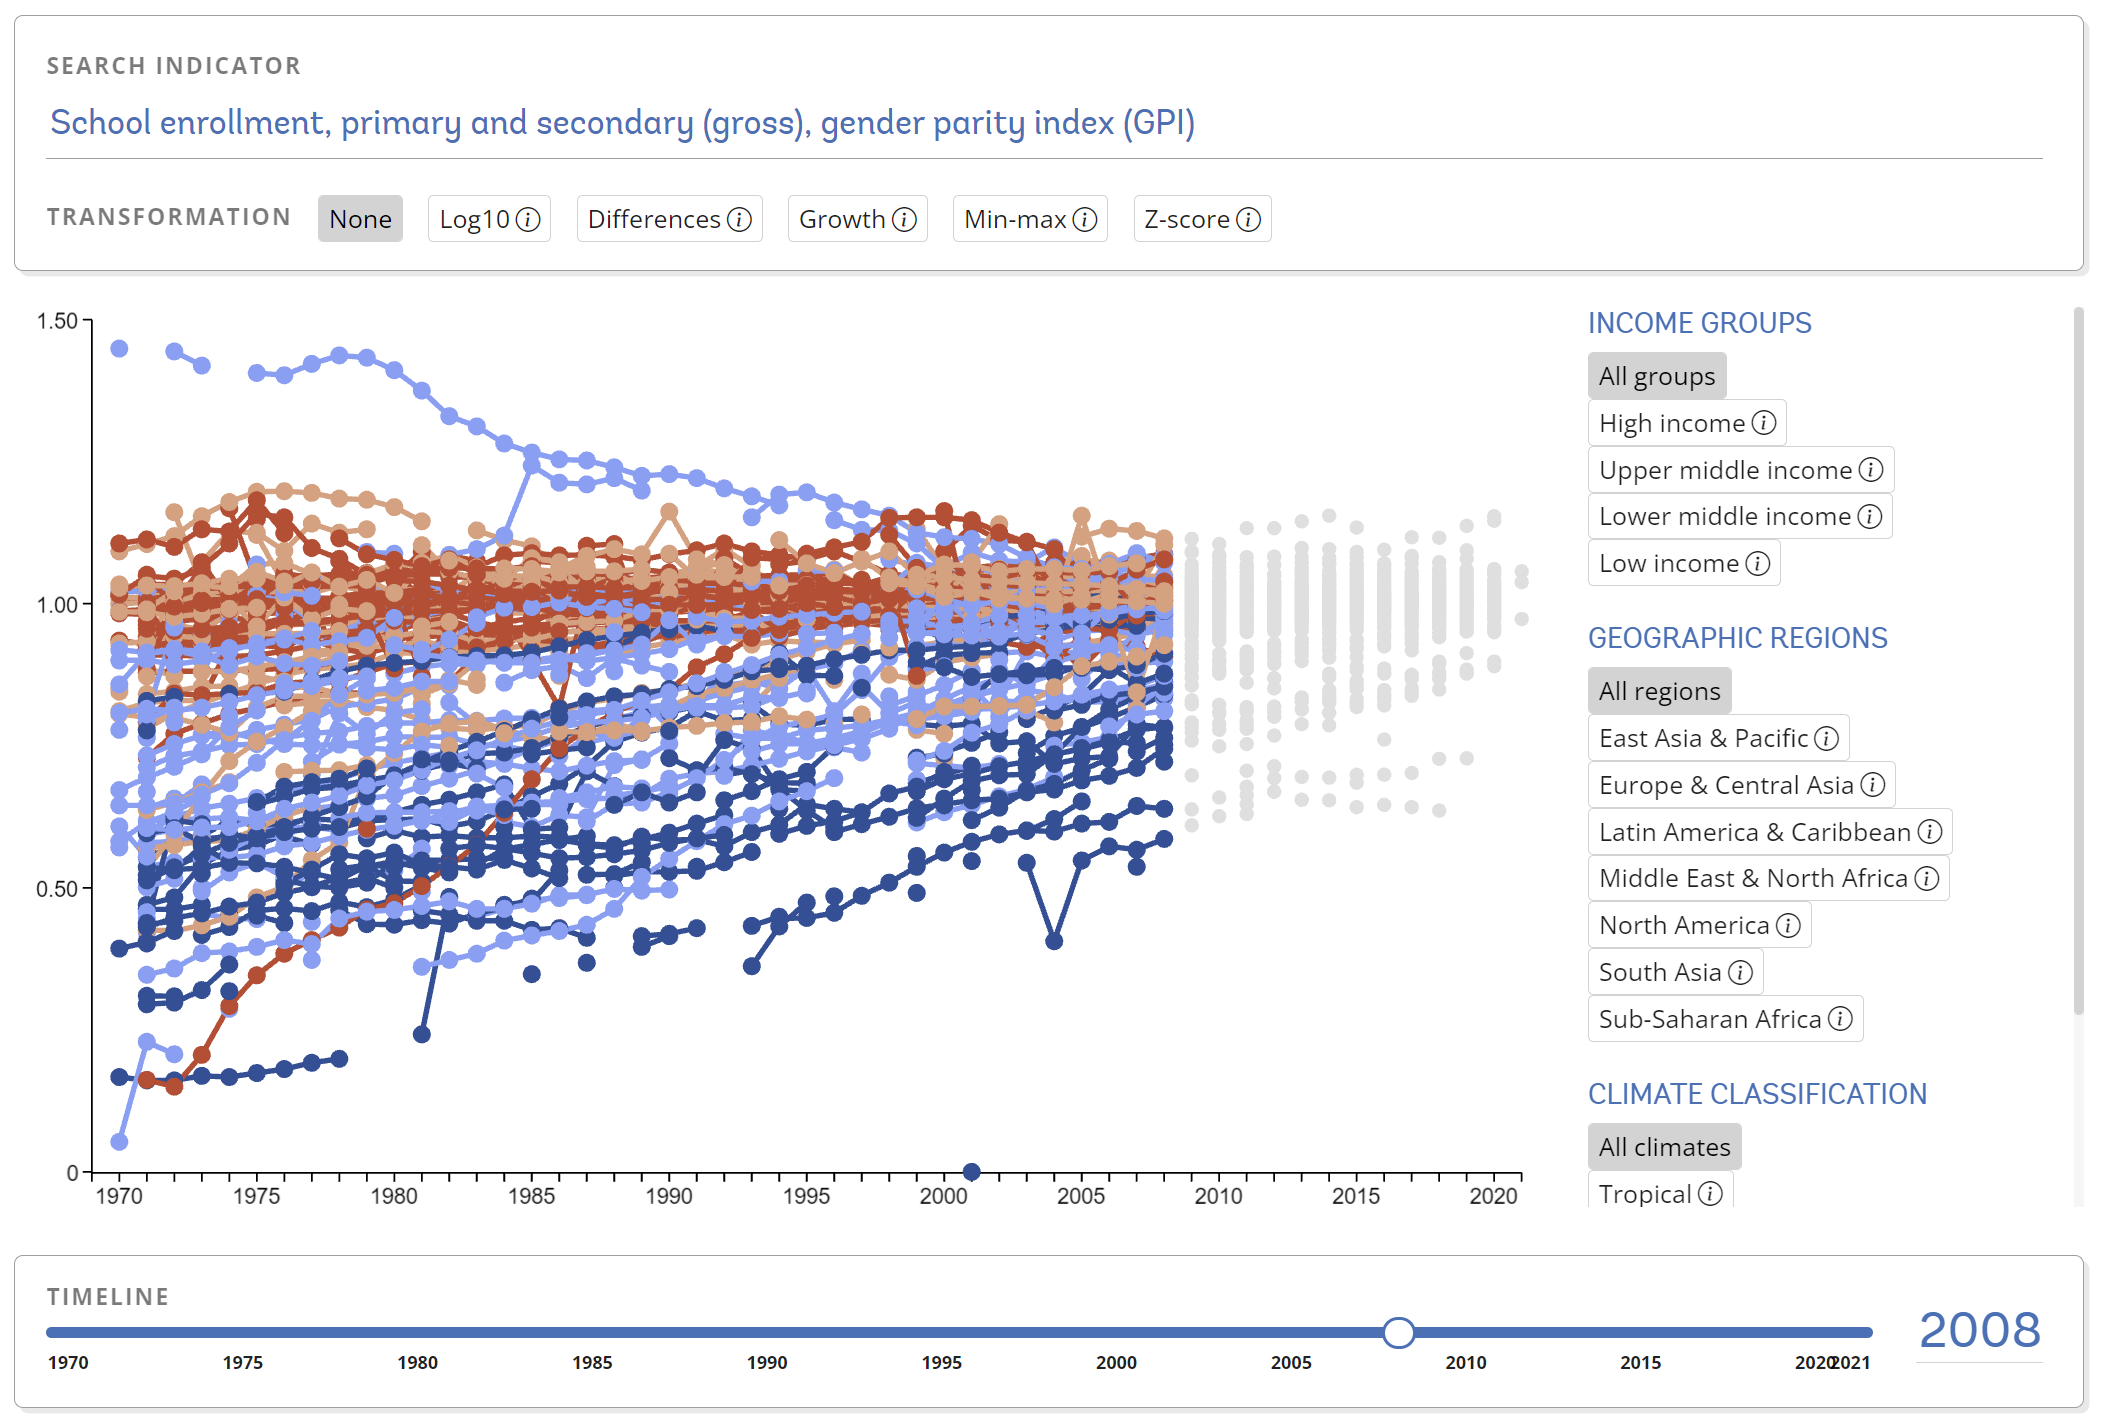 How the ratio of girls to boys enrolled at primary and secondary levels in public and private schools evolved over time. Explore this picture
New tool: Income adjustments
A country's income, development indicators and sovereign ESG scores are intricately connected. Without considering the role of income, using sovereign ESG scores could lead to unintended outcomes. This page discusses what this income bias is about, and when it makes sense to adjust for it and allows you to explore the effect of income adjustments.
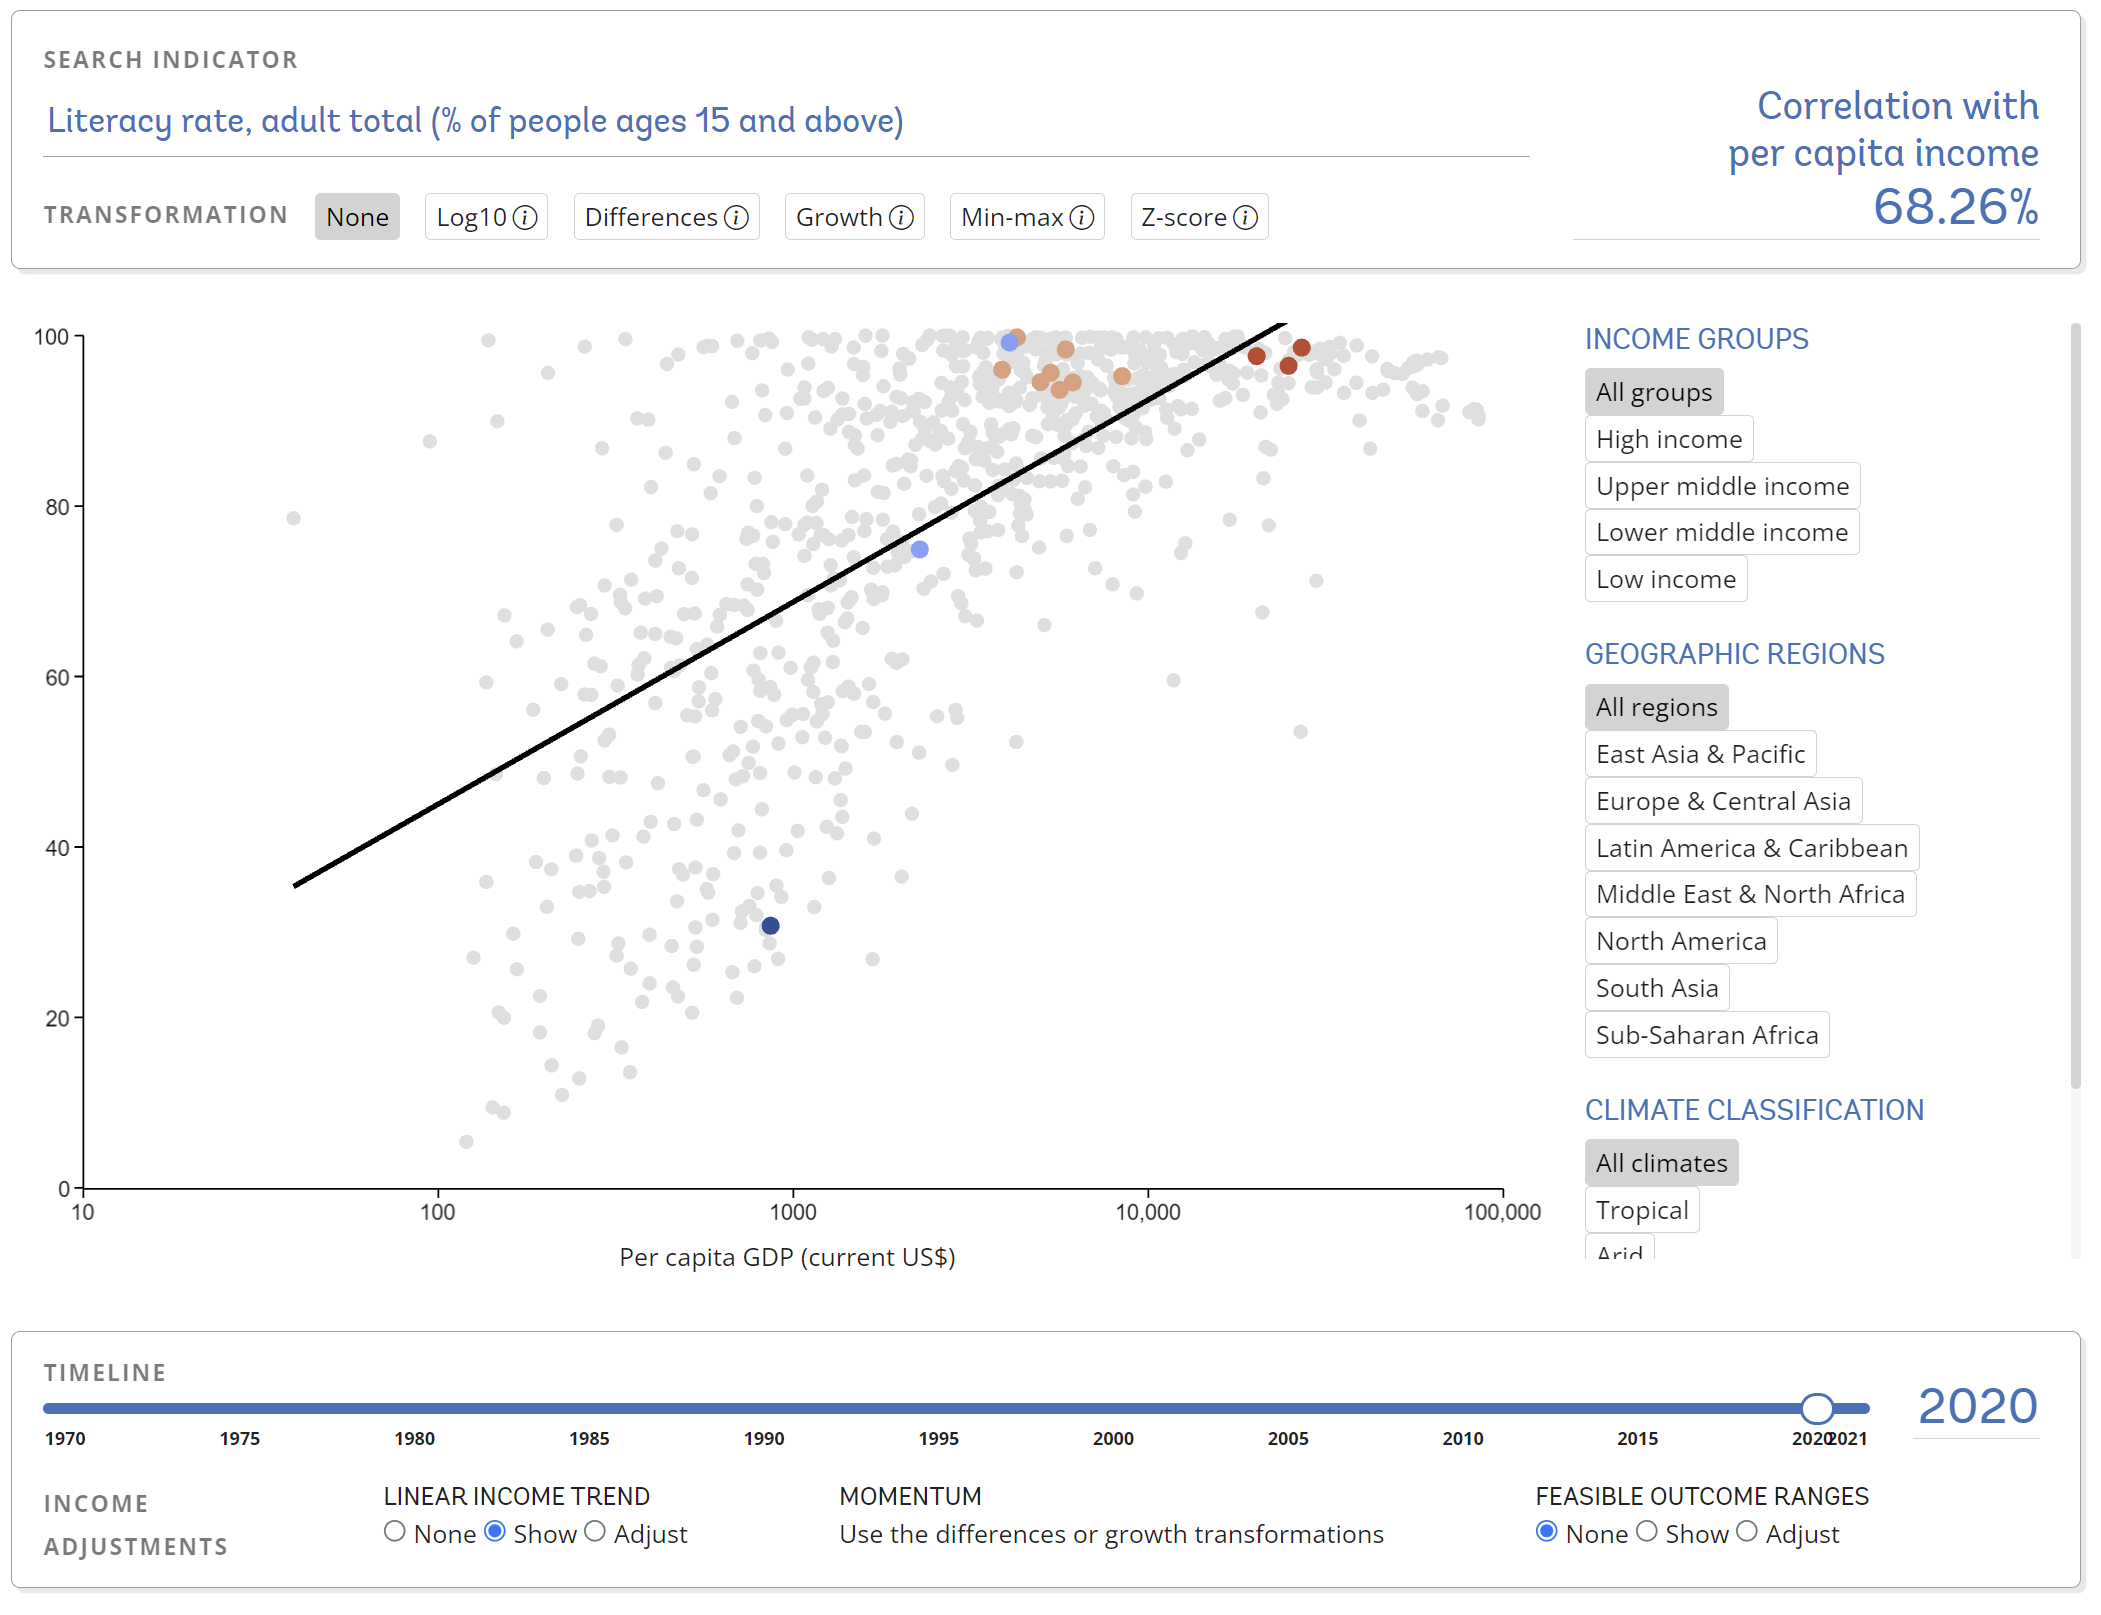 Literacy rate and per capita income are positively correlated. Explore this picture
New tool: Quadrant analysis
A common approach to understanding relationships between two datasets is simply plotting them against each other. By displaying them in a single scatter plot, we can see correlations, trends or outliers. Quadrant analysis divides this plot into four areas, making it more evident who the leaders and the laggards are. Which countries tend to perform well or badly along both dimensions (bottom-left and top-right quadrants)? Which countries do well in one dimension but not the other?
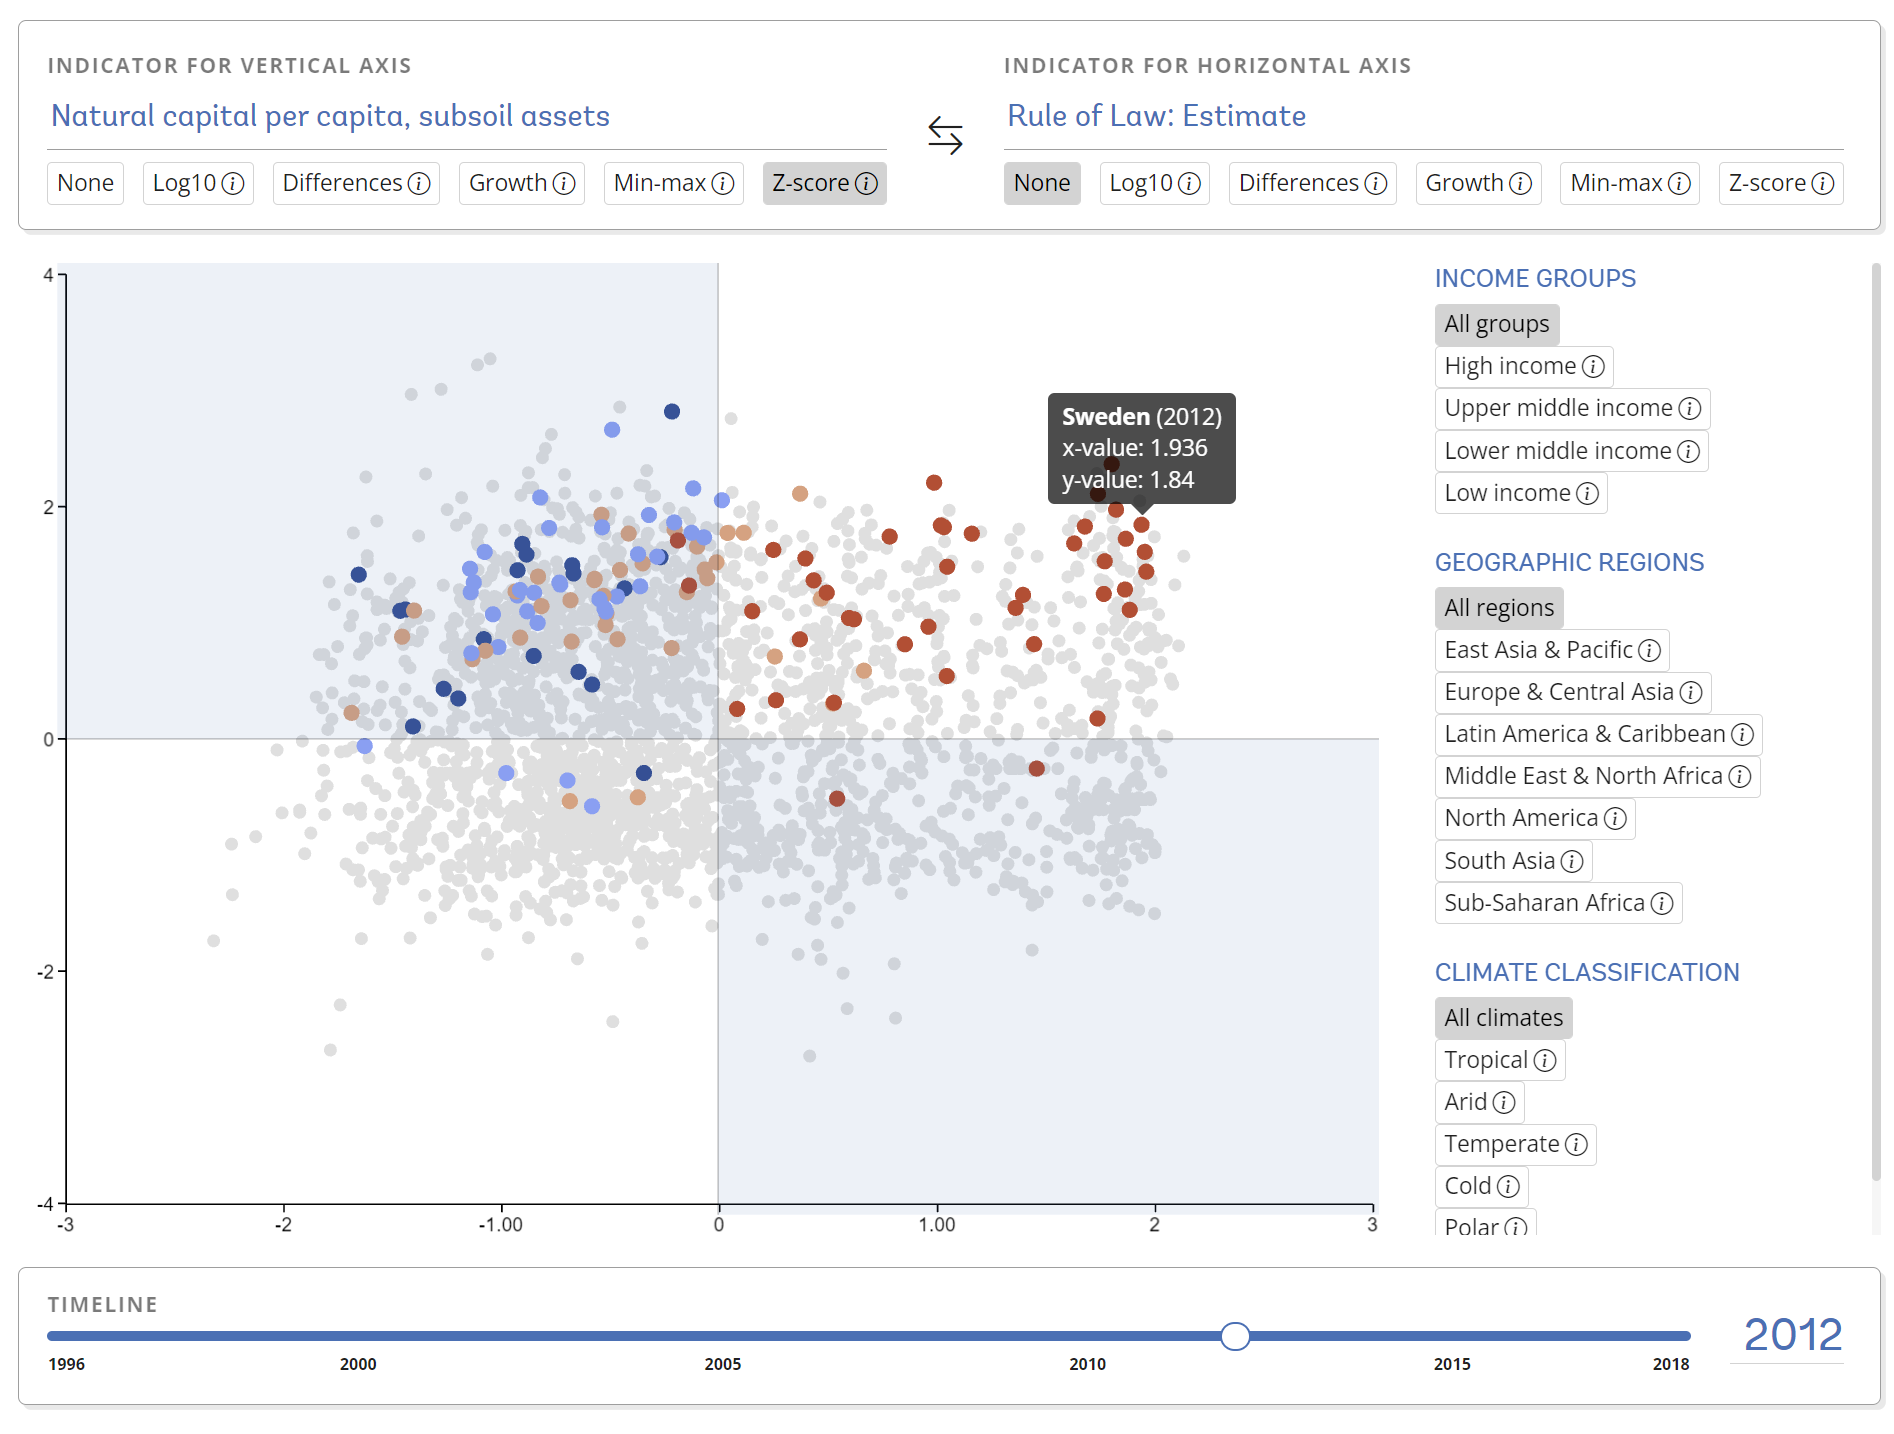 Subsoil assets and the rule of law span four quadrants. Explore this picture
New tool: Score builder
Aggregate ESG scores are sometimes difficult to understand since they often aggregate the data of several countries and/or multiple indicators. How should they be weighted? Is one indicator more relevant than another? Moreover, depending on the use case, one may want to exclude certain countries or look at the changes rather than the levels of an indicator. All this can be accomplished with the score builder tool.
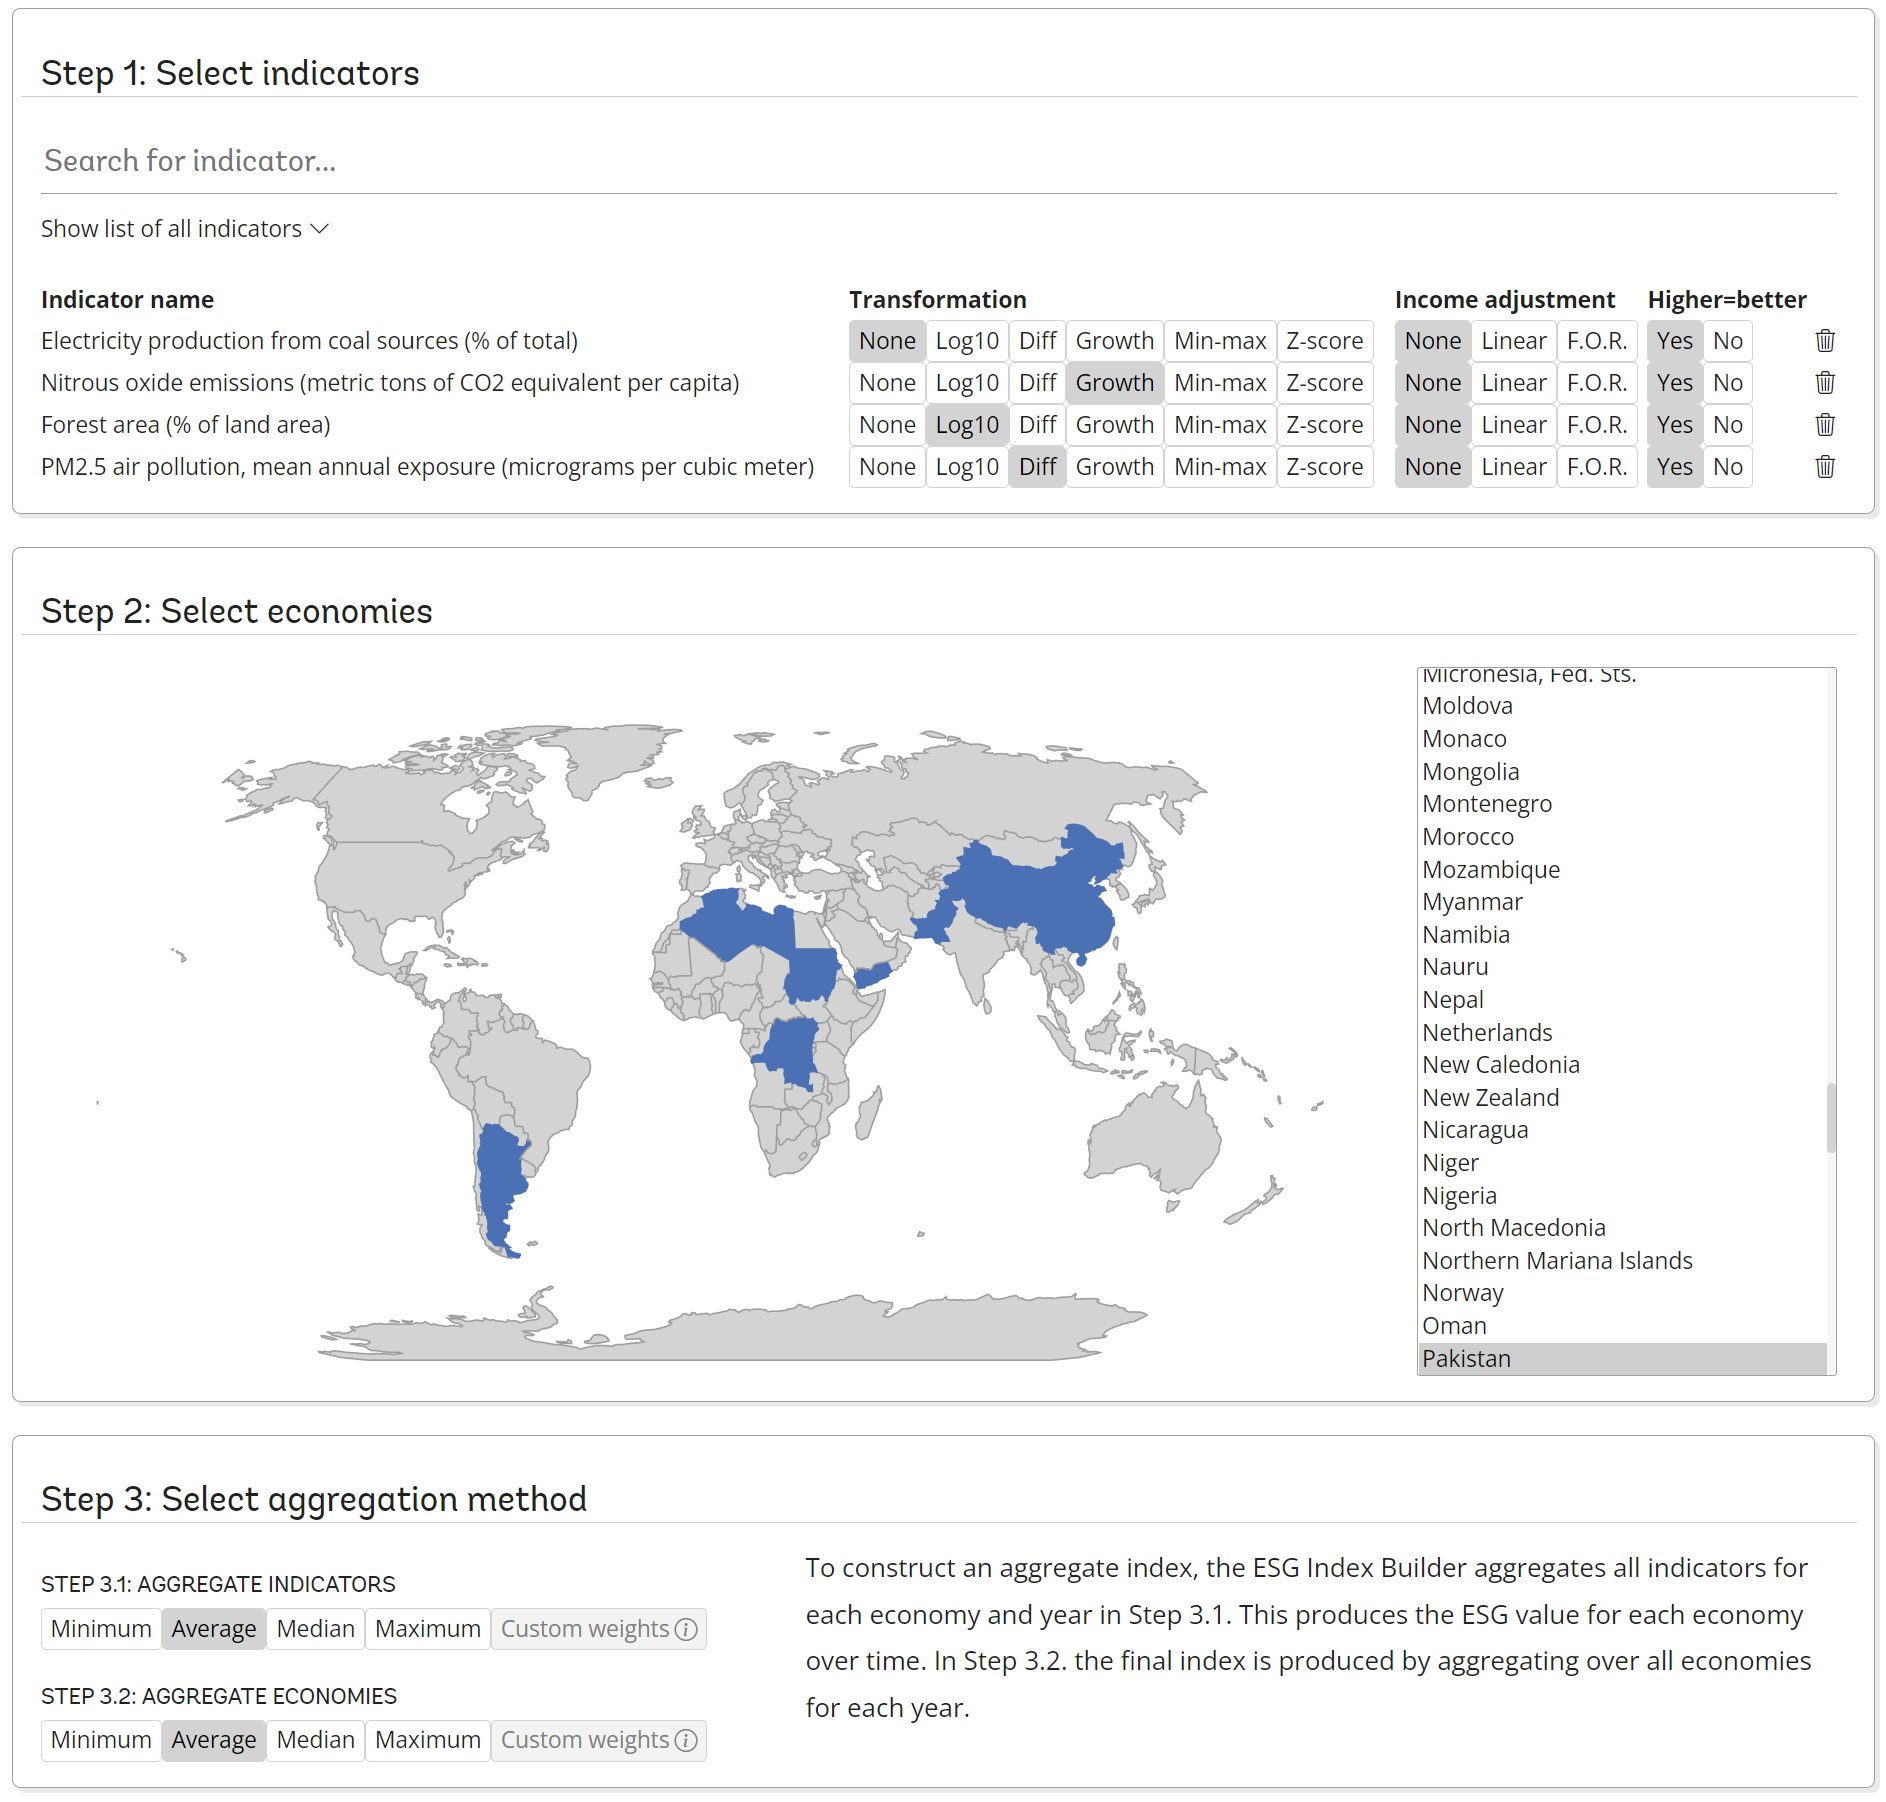 Select the countries and indicators to build your own custom ESG score. Explore this picture
What's next?
Sovereign ESG has grown tremendously within just three years since we first started the Portal (BETA) and it will continue to do so. The new portal expanded the data framework and several new tools. Nevertheless, much remains to be done. One of the most important projects currently underway includes a large-scale, advanced machine learning exercise to fill in gaps in the past and estimate the most recent data. This requires us to collaborate and validate the results with experts across all ESG pillars before we will integrate it into the portal.