Data Update: The January 2026 update of the Sovereign ESG Data Portal delivers a broad refresh of the dataset, with close to 60 indicators updated across environmental, social, and governance pillars. This release improves data timeliness and expands the scope of the ESG framework, adding two core indicators related to employment. Curious about the details? Read on to discover what’s new in this data story.
Strengthening coverage across the ESG framework
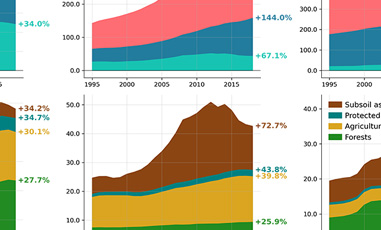
A total of 20 indicators within the core ESG framework were updated in this release, covering land use, greenhouse gasses, biodiversity, water, education, and basic services. These updates ensure continued alignment with international sources and extend time series for key measures.
Updated indicators include, among others:
- Agricultural land (% of land area) and Forest area (% of land area)
- Access to clean fuels and technologies for cooking (% of population)
- Total greenhouse gas emissions excluding LULUCF (MtCO2e) and emissions per capita , as well as updates to CO2 , methane (CH4) , and nitrous oxide (N2O) emissions
- Population density
- Water stress and freshwater withdrawals
- Education indicators, such as adult literacy , primary school enrollment , and government expenditure on education
- Access to safely managed drinking water and sanitation services
- Prevalence of undernourishment
Expanding the framework: new indicators on jobs and youth inclusion
This update expands the core ESG framework with two indicators focused on labor market outcomes:
- Wage and salaried workers (% of total employment)
- Share of youth not in education, employment or training (NEET)
These indicators are part of the World Bank Group Scorecard , a unified results framework designed to track progress on key development outcomes across the Bank’s institutions and client countries. Jobs are central to the World Bank’s development strategy because employment is at the core of poverty reduction, economic stability, and shared prosperity. The challenge is large: over 1 billion young people are expected to enter the global labor force in the next decade, and quality employment opportunities will be crucial to ensure sustainable growth and social stability.
The newly added indicators measure the structure and inclusiveness of labor markets. The share of wage and salaried workers is an indicator for the formality of labor markets and of the quality of jobs in an economy. Salaried workers typically have more predictability in their income and better access to social safety nets. The share of the youth not in education, employment or training captures how many young people are disconnected from the labor market and education systems and at risk of social and economic exclusion. It also reflects a country’s untapped potential of youth who could contribute to national development through productive employment or investment in skills.
Open this view in the portal.The new indicators are available across all the Sovereign ESG Data Portal tools, including the Feasibility and Ambitiousness (FAB) Dashboard , enabling users to identify credible and realistic targets for jobs-related indicators.
Biodiversity and ecosystems: recent updates
Several biodiversity-related indicators were updated as part of this release, including Forest area (% of land area) , Mammal species, threatened , and Coastal protection , which now reflects data through 2025.
Coastal protection is one of the goal components of the Ocean Health Index , a science-based framework that evaluates how well oceans deliver benefits to people by tracking ecosystem condition and services over time using globally comparable data. The indicator measures the extent to which marine and coastal habitats, such as coral reefs, mangroves, seagrasses, salt marshes, and sea ice, continue to provide natural protection against storms, flooding, and erosion compared to historical conditions. Globally, substantial declines in coastal habitats over recent decades have increased exposure to coastal hazards, underscoring the importance of conservation and restoration.
All data from the Sovereign ESG Data Portal is available for download . Want to stay informed? Sign up for the newsletter to be notified about future data updates and releases.