New dataset
Drought is a major hydroclimatic hazard, with vast and varied socioeconomic and environmental impacts across the world. Between 1970 and 2019, drought affected about 55 million people every year, leading to significant loss of human life with more than 650,000 deaths
Read more
Putting data to work
The peer comparison method provides a robust, transparent and intuitive way to assess whether a country's sustainability performance was extraordinary or nothing special — compared to its peers. It allows investors to link financial incentives with key performance indicators and reward “better-than-expected” performance.
Read more
Portal update
Since the launch of our Sovereign ESG Data Portal (BETA) back in 2019, the ESG investing space has grown by leaps and bounds. ESG has become such a central point of discussion that it's hard to find a financial newspaper doesn't feature an article about climate, sustainability or green finance on its front page.
Read more
Portal update

Data update: March 2024

Data Update: This March, our Sovereign ESG Data Portal got expanded with new country data and extended timelines. It is now possible to gain insights into our 135 indicators with the most recent data up to 2022. The World Bank is continuously refining the ESG framework and empowering users to make their own comprehensive analyses. All our updated data can be downloaded for easy use. Curious what’s new? Read about the details in this data story.

Expanding horizons

With the updated dataset, many indicators got one or more years added. Over 30 indicators have 2022 data available now, and the majority of ESG indicators spans up to 2020. Starting from 1960, our data is suitable for time series analysis to see how the ESG landscape evolved over time.

Next to ESG indicators, we have additional indicators for wealth accounting and country key statistics available to give context to the ESG framework. These additional indicators got an update as well. Most of the key statistics, including annual population growth and GDP per capita, are now available up to 2022.

We did not only extend the timelines, but a lot of indicators are also enriched with extra country data. For example, Puerto Rico now has data for its share in renewable electricity output, people with access to electricity, and primary and secondary school enrolment rates. Or have a look at Greenland’s new indicators, like its share of agricultural land or forest area, and its population’s life expectancy at birth.

Explore the updated coverage

When you visit our framework, you get an overview of the ESG indicators in our portal. It shows at a glance the data richness for each indicator. The timeline spanning from 1960 to 2022 shows per indicator which years it covers. The height of the boxes show the amount of countries included. Take a look at People using safely managed drinking water services (% of population), for example, to see the value of our updated dataset:
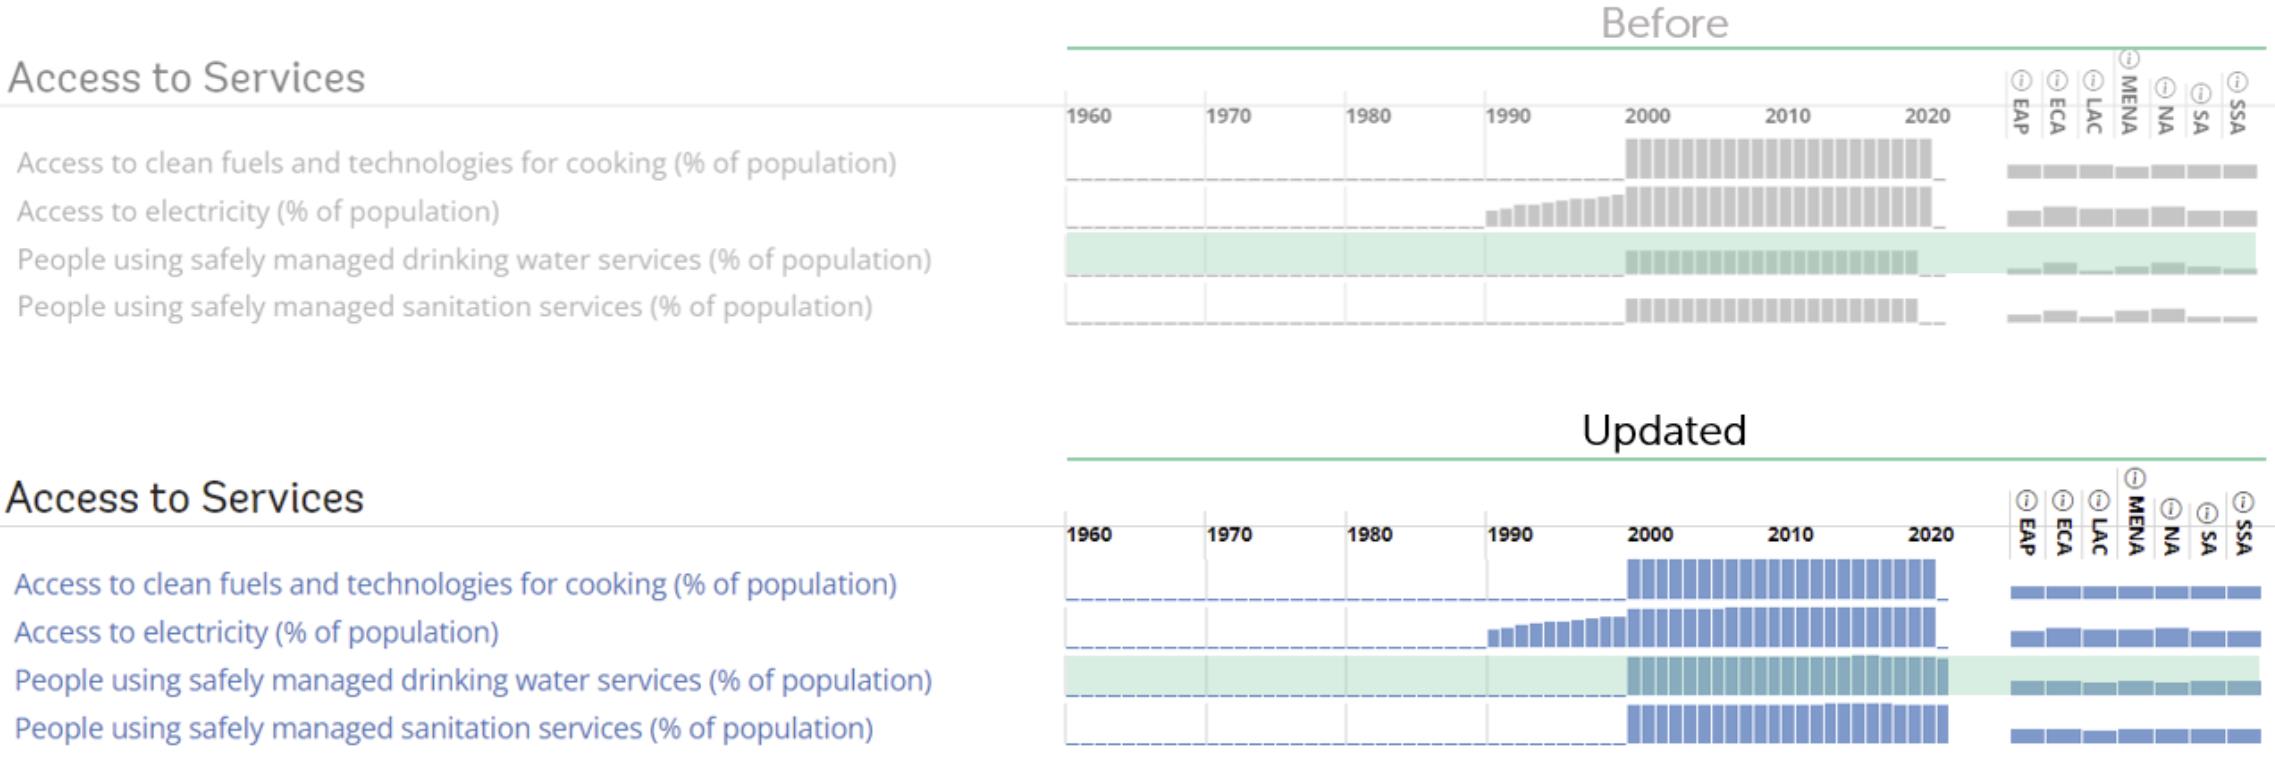
Expanded temporal and country coverage
Source: World Bank

More to explore

When you visit our framework, you get an overview of the ESG indicators in our portal. It shows at a glance the data richness for each indicator. The timeline spanning from 1960 to 2022 shows per indicator which years it covers. The height of the boxes show the amount of countries included. Take a look at People using safely managed drinking water services (% of population), for example, to see the value of our updated dataset:

Open this view in the portal.

Notes

  • Placeholder

References

  • Placeholder

Latest data stories

Portal update
This March, our Sovereign ESG Data Portal got expanded with new country data and extended timelines. It is now possible to gain insights into our 135 indicators with the most recent data up to 2022.
Read more
New dataset
Drought is a major hydroclimatic hazard, with vast and varied socioeconomic and environmental impacts across the world. Between 1970 and 2019, drought affected about 55 million people every year, leading to significant loss of human life with more than 650,000 deaths
Read more
Putting data to work
The peer comparison method provides a robust, transparent and intuitive way to assess whether a country's sustainability performance was extraordinary or nothing special — compared to its peers. It allows investors to link financial incentives with key performance indicators and reward “better-than-expected” performance.
Read more
Portal update
Since the launch of our Sovereign ESG Data Portal (BETA) back in 2019, the ESG investing space has grown by leaps and bounds. ESG has become such a central point of discussion that it's hard to find a financial newspaper doesn't feature an article about climate, sustainability or green finance on its front page.
Read more
New dataset
The Economic and Social Rights Performance Score is one of the new indicators in the Sovereign ESG data portal. This dataset was developed by the Human Rights Measurment Initiative and that quantifies the Quality of Life across five dimensions. Right to education, right to food, right to health, right to housing and right to work. These scores measure how well a country is using its resources to ensure people's economic and social rights are fulfilled. By nature of its constructuion, the score automatically adjusts for the ingrained income bias.
Read more
New dataset
Wealth accounting—the balance sheet for a country—captures the value of all the assets that generate income and support human well-being. Gross domestic product (GDP) indicates how much monetary income or output a country creates in a year; wealth indicates the value of the underlying national assets
Read more