Portal update
The Sovereign ESG Data Portal is updated with the most recent data in the ESG landscape. This update increased the number of indicators to 171, available for 213 economies up to 2023. The World Bank is continuously refining the ESG framework and empowering users to make their own comprehensive analyses. Curious what’s new? Read about the details in this data story.
Read more
Putting data to work
Showcasing the Peruvian Amazon, we see how cloud cover challenges can be tackled to monitor forest changes more presicely using a new data product.
Read more
Portal update
This March, our Sovereign ESG Data Portal got expanded with new country data and extended timelines. It is now possible to gain insights into our 135 indicators with the most recent data up to 2022.
Read more
Putting data to work

Driving sustainability with new insights: refining deforestation KPIs to strengthen green financing

Image of the Peruvian Amazon rainforest
Source: Photo from Unsplash

This data story is the second part of a series on new satellite-based data about deforestation and land use changes in the Peruvian Amazon developed through the European Space Agency's (ESA) Global Development Assistance (GDA) program under a partnership between ESA and the World Bank. Read Part 1 here: Peering through the clouds in the Peruvian Amazon.

Financial instruments that enhance sustainability are on the rise in Latin America, especially those that target forest preservation. Uruguay, for example, issued a Sovereign Sustainability-Linked Bond (SLB) with the maintenance of native forest area as one of its key performance indicators (KPIs). Together with the Inter-American Development Bank, the World Bank is developing the core elements of the guidelines for the so-called Amazonia Bonds . These innovative Green, Social and Sustainability Bonds will support the holistic, sustainable development of Amazonia and finance zero deforestation efforts in the Amazon region.

Peru's green finance agenda has gained momentum recently, with the country's first Sustainable Bonds in October 2021 ($2.25 billion in 12-year bond and $1 billion in 50-year bond) under its Sustainable Bond Framework , a $1 billion social bond and a $2.5 billion sustainable sovereign bond in local currency. KPI-linked green finance, including SLBs, can be an important instrument to support Peru's green finance agenda in line with the development of climate finance instruments that Peru's Green Finance Roadmap prioritizes.

KPI-linked green finance incentivizes borrowers to achieve ambitious, predetermined sustainability performance targets by linking financial incentives to sustainability performance. Well-defined KPIs are necessary to generate credible, reliable and transparent measures of progress towards the sustainability objectives (Flugge, Mok, Stewart 2021) .

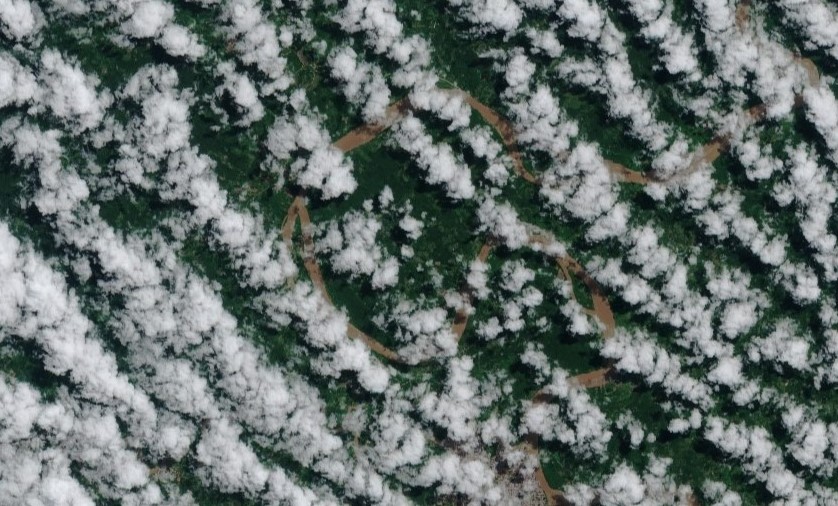
The updated Hansen et al. (2013) dataset made available by Global Forest Watch is a commonly used source for tree cover loss data at the national level. It follows a harmonized methodology that makes the data internationally comparable. [1] However, the limitations of that dataset in terms of frequency and granularity reduce its usefulness for reporting on three crucial elements of forest preservation: sub-annual seasonality, land conversion of forest, and sub-national performance.

In the first part of this series , we introduced an improved data product for tree cover transitions using cloud peering technologies, combined with an enhanced change detection algorithm. This new data provides more nuance on the temporal and spatial dimensions of deforestation, strengthening the credibility of Monitoring, Reporting and Verification (MRV) systems. It also allows targets to be better tailored to the country specific context while remaining comparable across countries in the same geographic or climatic group.

Tracking progress with sub-annual KPIs

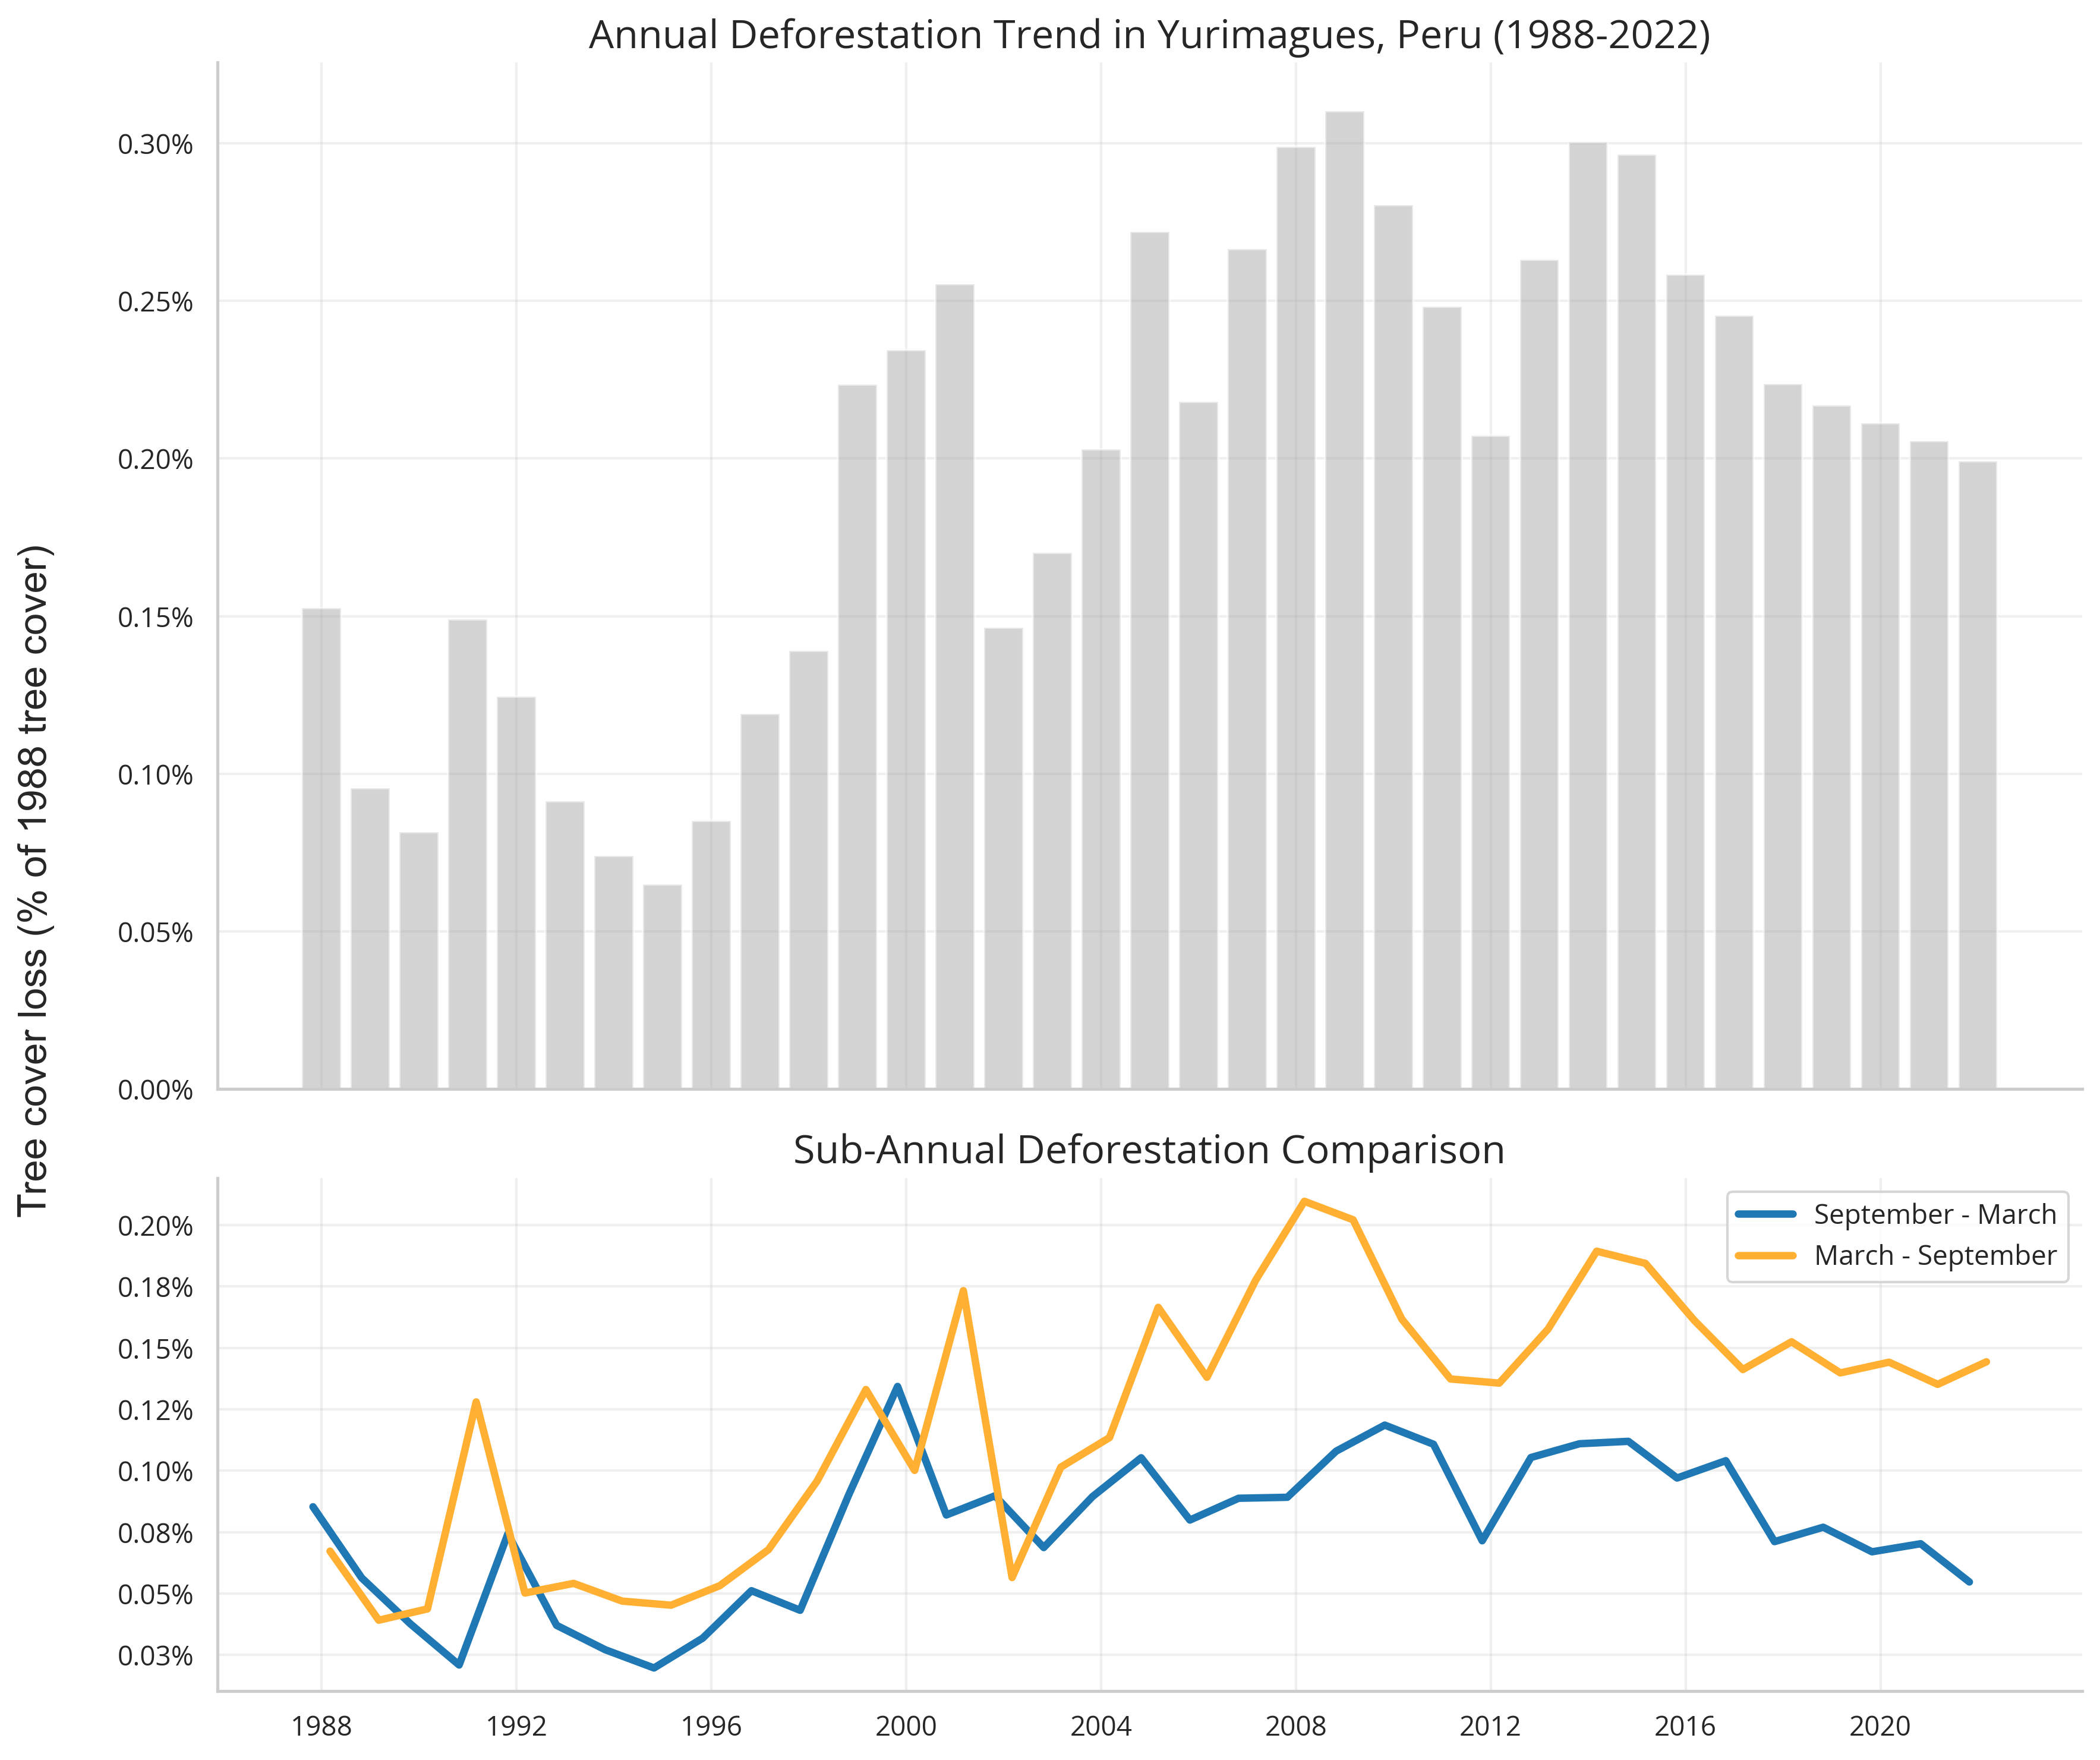
On a temporal dimension, we can now establish sub-annual KPIs because measurements happen more frequently, are less impacted by cloud cover and because images from different seasons are not overlayed to produce one annual mosaic image. Having information at the sub-annual level will help to set targets throughout the year, account for seasonality and weather when monitoring deforestation and compare outcomes against similar time spans.

Timeseries of
tree cover loss rates from 1988 to 2022 in Yurimaguas, Peru. The total tree cover loss rates range from a loss 0.075
percent relative to the total 1988 tree cover to 0.3 percent. The peak occurs in 2008 and 2013. The annual values are
split into two subannual periods: September to March and March to September. Tree cover loss is consistently higher in
the March to September period.
Sub-annual data reveals that tree cover loss in Yurimaguas, Peru, happens in the dry half of the year, between March and September. This temporal variation is useful when establishing more precise targets for financial instruments. Source: World Bank

Tailoring targets to the context

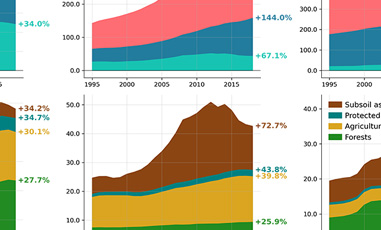
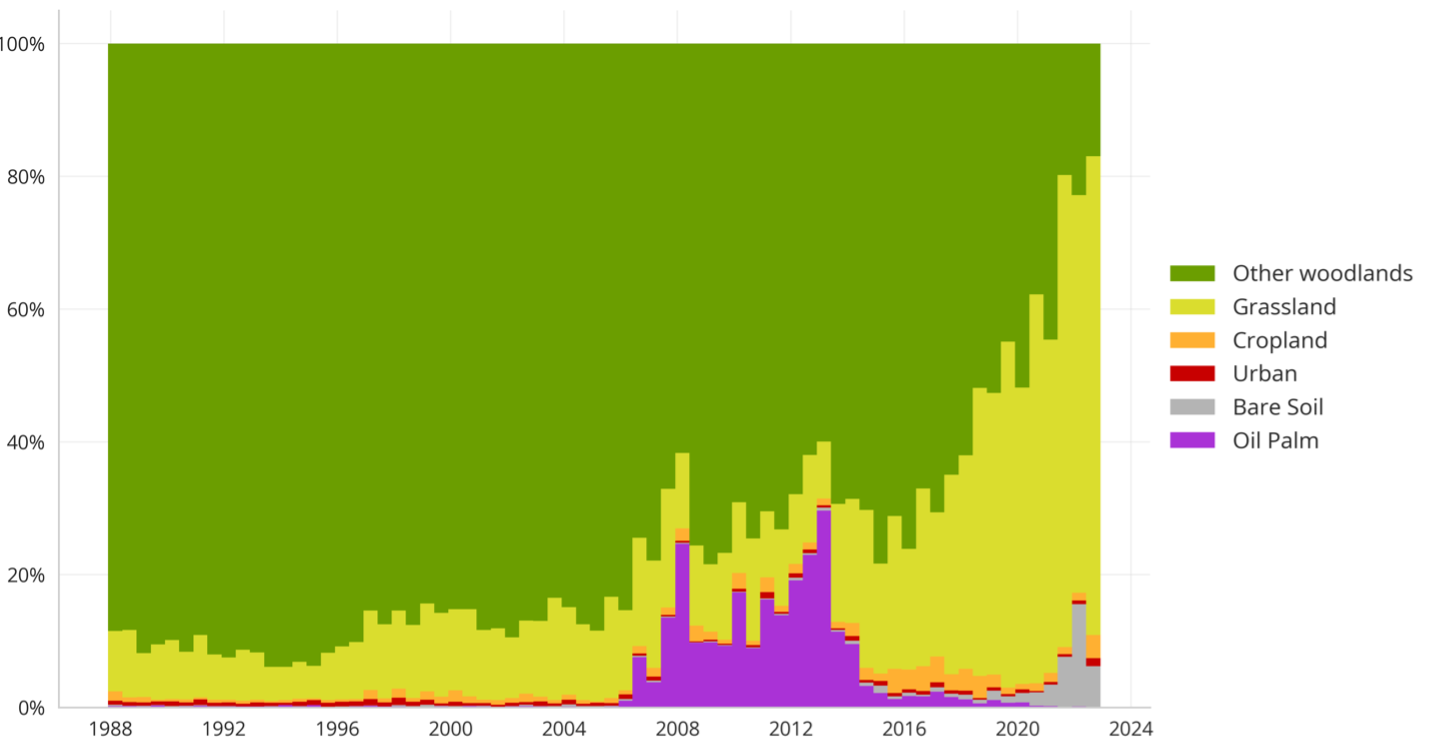
New information on land cover transitions tells us what is happening now on recently deforested land. It allows us to target policies and to set targets based on land use. Deforestation in Latin America is mostly driven by agricultural demand, yet a single map of deforestation aggregates many different land-use changes into an oversimplified image. With information on land use, we can reflect the diverse landscape and learn about the economic incentives for deforestation.

In this case study, we tailored the data to the context of Peru and classified oil palm plantations as a separate land cover class. The detailed land cover transition data would allow us to target policies to the relevant drivers of deforestation and to set KPIs based on more specific objectives. For example, a general KPI on reducing deforestation could be refined to specify reducing deforestation due to palm oil expansion.

Timeseries of tree cover transition data from 1988 to 2022 for Yurimaguas, Peru. The graph
shows that most tree cover transitions to other woodlands until 2004. Between 2006 and 2018 there is a notable increase
in transitions to oil palm plantations (at the peak in 2008 and 2013, 25-30 percent of all transitions are to oil palm
plantations). After 2018 transitions to grassland increase significantly to about 60 percent of all transitions in
2022.
The transitions from tree cover to other land covers in Yurimaguas area, Peru (% of total), show that tree cover was mainly replaced by other woodlands, grassland, and oil palm plantations. Especially between 2007 and 2015, conversion to oil palm was a significant driver of deforestation.

Highlighting regional efforts

On the spatial dimension, we can set targets that go below the national level: The 30-meter resolution of the new maps allow for spatially explicit performance targets, improved coordination of policy responses and a better understanding of the spatial determinants of deforestation.

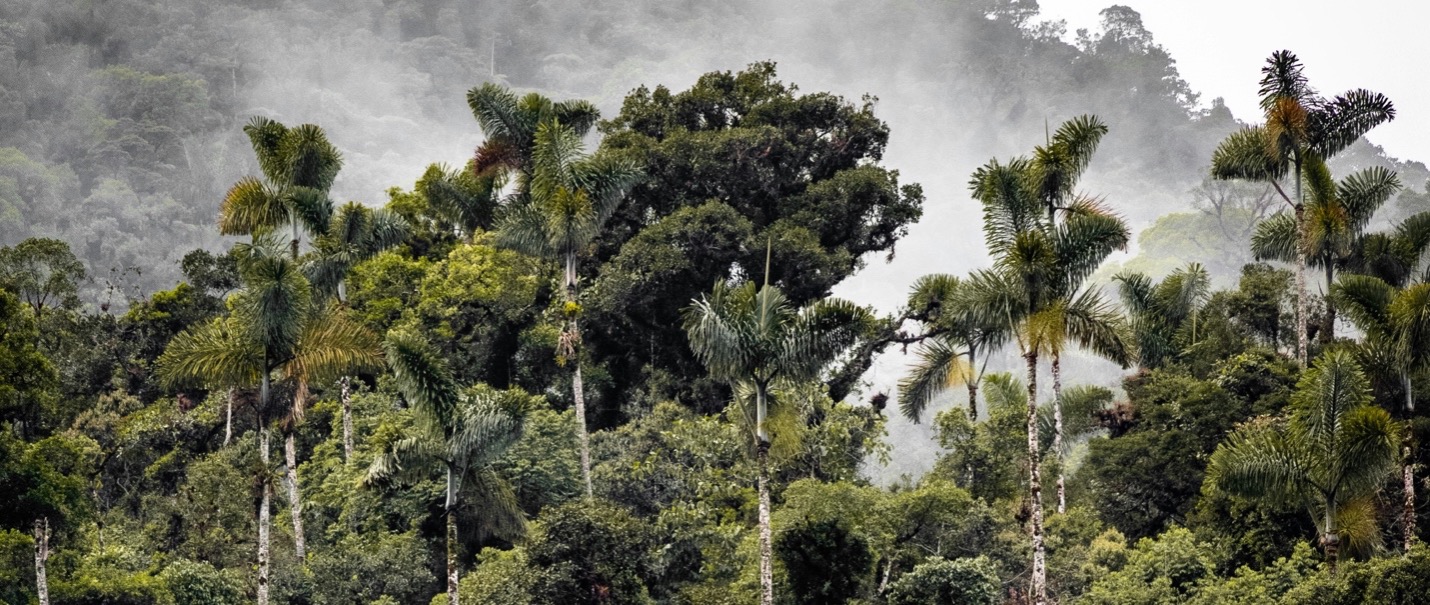
In Yurimaguas, the expansion of deforestation is not only triggered by the closeness to the Yurimaguas settlement, but also to the road network. Deforestation also mostly occurs as an extension of previously deforested areas. Understanding these determinants is crucial in order to complement the design of KPIs for financial instruments with promising policy interventions.

The new data product allows us to have accurate, scalable land cover maps at the sub-annual level and with improved spatial resolution, for a longer time span than is currently available. It is now possible to have stronger KPIs with credible Monitoring, Reporting and Verification systems that can be used for better suited, more ambitious financial instruments to fight deforestation.

Read about the cloud peering technologies and the enhanced change detection algorithm underlying the new data product in the first part of this series: Peering through the clouds in the Peruvian Amazon.

Notes

  • Placeholder
  • See https://data.globalforestwatch.org/documents/941f17325a494ed78c4817f9bb20f33a/explore for the updated data and methodology.

References

  • Placeholder
  • Flugge, Mark Lester; Mok, Rachel Chi Kiu; Stewart, Fiona Elizabeth (2021). Striking the Right Note: Key Performance Indicators for Sovereign Sustainability-Linked Bonds (English). Washington, D.C.: World Bank Group. Available at: http://documents.worldbank.org/curated/en/935681641463424672

  • Hansen, M. C. et al. (2013). High-Resolution Global Maps of 21st-Century Forest Cover Change. Science, 324, 850-853. Available at: https://doi.org/10.1126/science.1244693

Latest data stories

New Portal update
The Sovereign ESG Data Portal is updated with the most recent data in the ESG landscape. This update increased the number of indicators to 171, available for 213 economies up to 2023. The World Bank is continuously refining the ESG framework and empowering users to make their own comprehensive analyses. Curious what’s new? Read about the details in this data story.
Read more
New Putting data to work
Latin America’s trend towards sustainability enhancing financial instruments is on the rise. New data allows for sub-annual, sub-national and context-tailored deforestation KPIs.
Read more
New Putting data to work
Showcasing the Peruvian Amazon, we see how cloud cover challenges can be tackled to monitor forest changes more presicely using a new data product.
Read more
Portal update
This March, our Sovereign ESG Data Portal got expanded with new country data and extended timelines. It is now possible to gain insights into our 135 indicators with the most recent data up to 2022.
Read more
New dataset
Drought is a major hydroclimatic hazard, with vast and varied socioeconomic and environmental impacts across the world. Between 1970 and 2019, drought affected about 55 million people every year, leading to significant loss of human life with more than 650,000 deaths
Read more
Putting data to work
The peer comparison method provides a robust, transparent and intuitive way to assess whether a country's sustainability performance was extraordinary or nothing special — compared to its peers. It allows investors to link financial incentives with key performance indicators and reward “better-than-expected” performance.
Read more
Portal update
Since the launch of our Sovereign ESG Data Portal (BETA) back in 2019, the ESG investing space has grown by leaps and bounds. ESG has become such a central point of discussion that it's hard to find a financial newspaper doesn't feature an article about climate, sustainability or green finance on its front page.
Read more
New dataset
The Economic and Social Rights Performance Score is one of the new indicators in the Sovereign ESG data portal. This dataset was developed by the Human Rights Measurment Initiative and that quantifies the Quality of Life across five dimensions. Right to education, right to food, right to health, right to housing and right to work. These scores measure how well a country is using its resources to ensure people's economic and social rights are fulfilled. By nature of its constructuion, the score automatically adjusts for the ingrained income bias.
Read more
New dataset
Wealth accounting—the balance sheet for a country—captures the value of all the assets that generate income and support human well-being. Gross domestic product (GDP) indicates how much monetary income or output a country creates in a year; wealth indicates the value of the underlying national assets
Read more