Portal update
This March, our Sovereign ESG Data Portal got expanded with new country data and extended timelines. It is now possible to gain insights into our 135 indicators with the most recent data up to 2022.
Read more
New dataset
Drought is a major hydroclimatic hazard, with vast and varied socioeconomic and environmental impacts across the world. Between 1970 and 2019, drought affected about 55 million people every year, leading to significant loss of human life with more than 650,000 deaths
Read more
Putting data to work
The peer comparison method provides a robust, transparent and intuitive way to assess whether a country's sustainability performance was extraordinary or nothing special — compared to its peers. It allows investors to link financial incentives with key performance indicators and reward “better-than-expected” performance.
Read more
New dataset

The Economic and Social Rights Performance Score

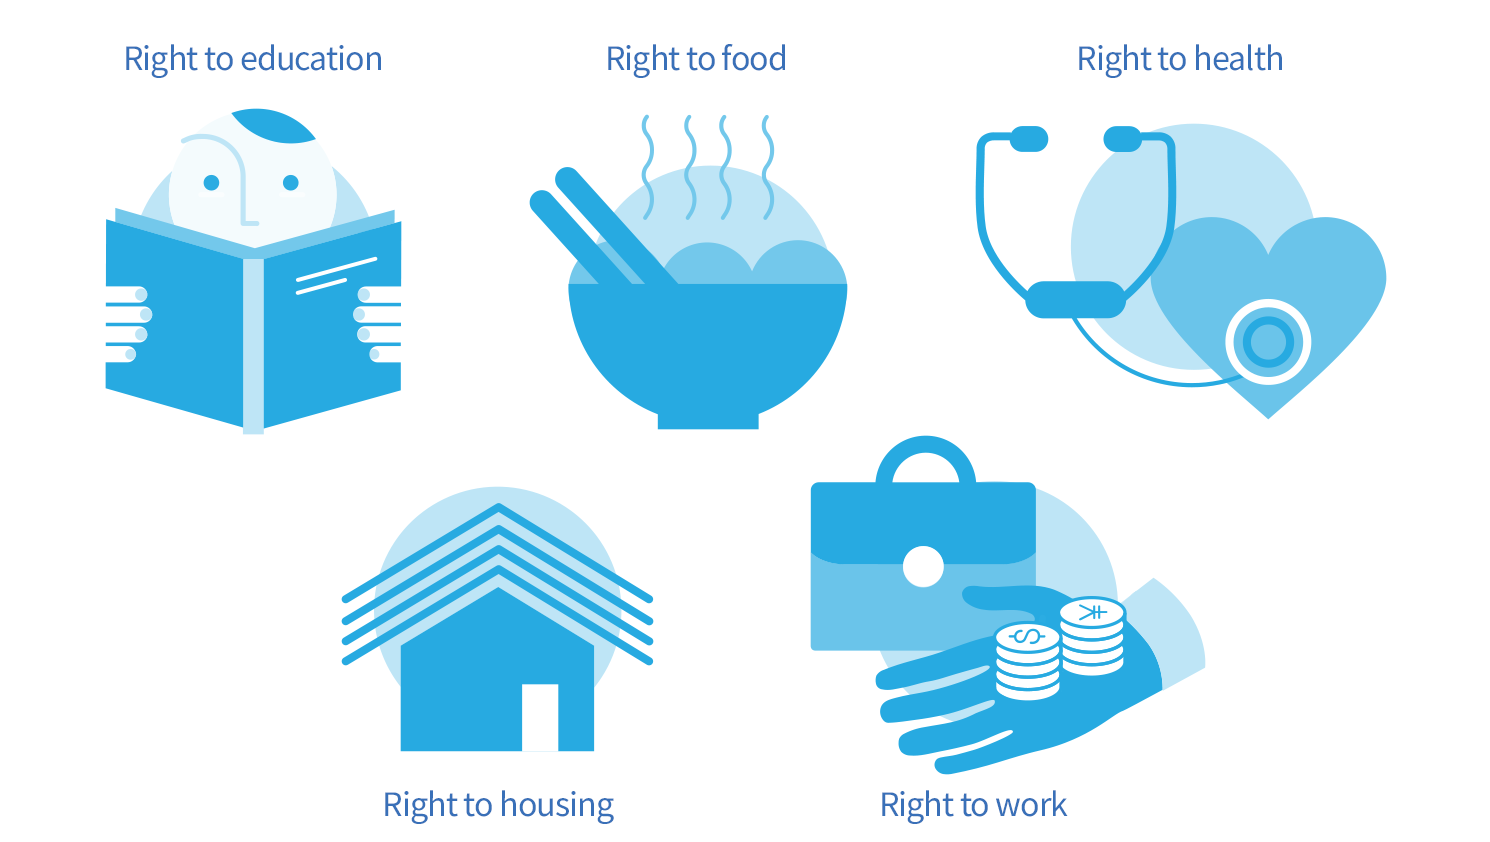
Illustrations of the rights to education, food, health, housing and work.
Source: Human Rights Measurement Initiative (HRMI)

The Economic and Social Rights Performance Score is one of the new additions to the Sovereign ESG data portal. This indicator was developed by the Human Rights Measurement Initiative (HRMI) and spans 189 countries between 2007 and 2018. As part of the Governance pillar, the dataset measures how effectively countries use their economic resources to ensure the fulfillment of five economic and social rights—the rights to education, food, health, housing and work.

Adjusted for the income bias — by definition

One of the most attractive features of the Economic and Social Rights Performance Score is that its methodology naturally adjusts for the ingrained income bias. Many of the widely used ESG indicators are afflicted by the income bias (see our Income Adjustment tool ). In the context of ESG investing, using unadjusted scores to guide investments can potentially lead to perverse outcomes: since richer countries tend to have better ESG scores, allocating investments based on ESG scores that are afflicted by this bias may inappropriately divert capital away from lower-income countries toward higher-income countries.

The Economic and Social Rights Performance Score strips out the income bias by computing the scores in relation to the so-called achievement possibilities frontier and the natural minimum threshold. The frontier traces what the best-performing countries have shown to be achievable at each income level. The natural minimum constitutes the lowest possible value in the absence of any government effort. In the case of net secondary school enrolment, this is 0.
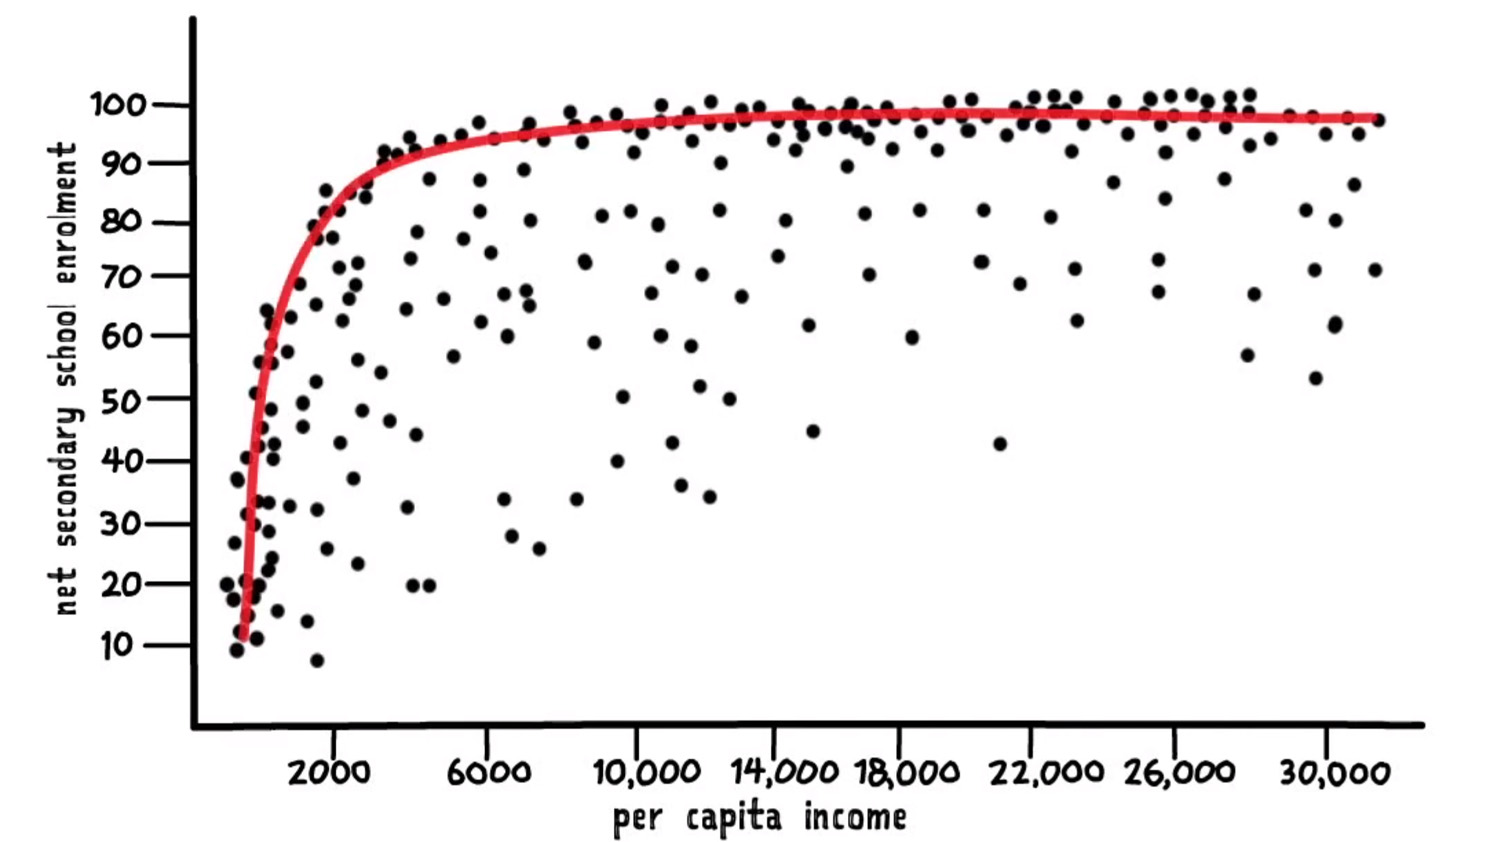
Scatter plot with per capita income on the horizontal and net secondary schoool enrolment on the vertical axis. A red curve envelopes the points from above.
Source: Human Rights Measurement Initiative (HRMI)

Methodology behind the score

The indicator is derived from the International SERF Index, which was developed for the Social and Economic Rights Fulfillment (SERF) Project serfindex.org by Sakiko Fukuda-Parr, Terra Lawson-Remer, and Susan Randolph and has been adopted by the Human Rights Measurement Initiative as their income-adjusted quality of life index ( humanrightsmeasurement.org and rightstracker.org ). Details on the motivation for and construction of the HRMI/SERF economic and social rights dataset can be found in Fukuda-Parr, Lawson-Remer and Randolph (2015) as well as a number of additional journal articles and methodology manuals .

Like other country-level datasets, economic and social rights data are not always available and are difficult to collect. The HRMI team at the University of Georgia’s GLOBIS Center therefore used a Bayesian latent variable model to estimate a full set of country scores, thus addressing the data gap problem. The result of this exercise is the completed dataset for 189 countries that are accessible on the Indicator page . More details on how the data was constructed and how it can be relevant for investors will be described in the upcoming report on “The Potential Implications of Economic and Social Rights for Sovereign Debt Investing”

Open this view in the portal.
Notes

  • Placeholder

References

  • Placeholder

Latest data stories

Portal update
This March, our Sovereign ESG Data Portal got expanded with new country data and extended timelines. It is now possible to gain insights into our 135 indicators with the most recent data up to 2022.
Read more
New dataset
Drought is a major hydroclimatic hazard, with vast and varied socioeconomic and environmental impacts across the world. Between 1970 and 2019, drought affected about 55 million people every year, leading to significant loss of human life with more than 650,000 deaths
Read more
Putting data to work
The peer comparison method provides a robust, transparent and intuitive way to assess whether a country's sustainability performance was extraordinary or nothing special — compared to its peers. It allows investors to link financial incentives with key performance indicators and reward “better-than-expected” performance.
Read more
Portal update
Since the launch of our Sovereign ESG Data Portal (BETA) back in 2019, the ESG investing space has grown by leaps and bounds. ESG has become such a central point of discussion that it's hard to find a financial newspaper doesn't feature an article about climate, sustainability or green finance on its front page.
Read more
New dataset
The Economic and Social Rights Performance Score is one of the new indicators in the Sovereign ESG data portal. This dataset was developed by the Human Rights Measurment Initiative and that quantifies the Quality of Life across five dimensions. Right to education, right to food, right to health, right to housing and right to work. These scores measure how well a country is using its resources to ensure people's economic and social rights are fulfilled. By nature of its constructuion, the score automatically adjusts for the ingrained income bias.
Read more
New dataset
Wealth accounting—the balance sheet for a country—captures the value of all the assets that generate income and support human well-being. Gross domestic product (GDP) indicates how much monetary income or output a country creates in a year; wealth indicates the value of the underlying national assets
Read more