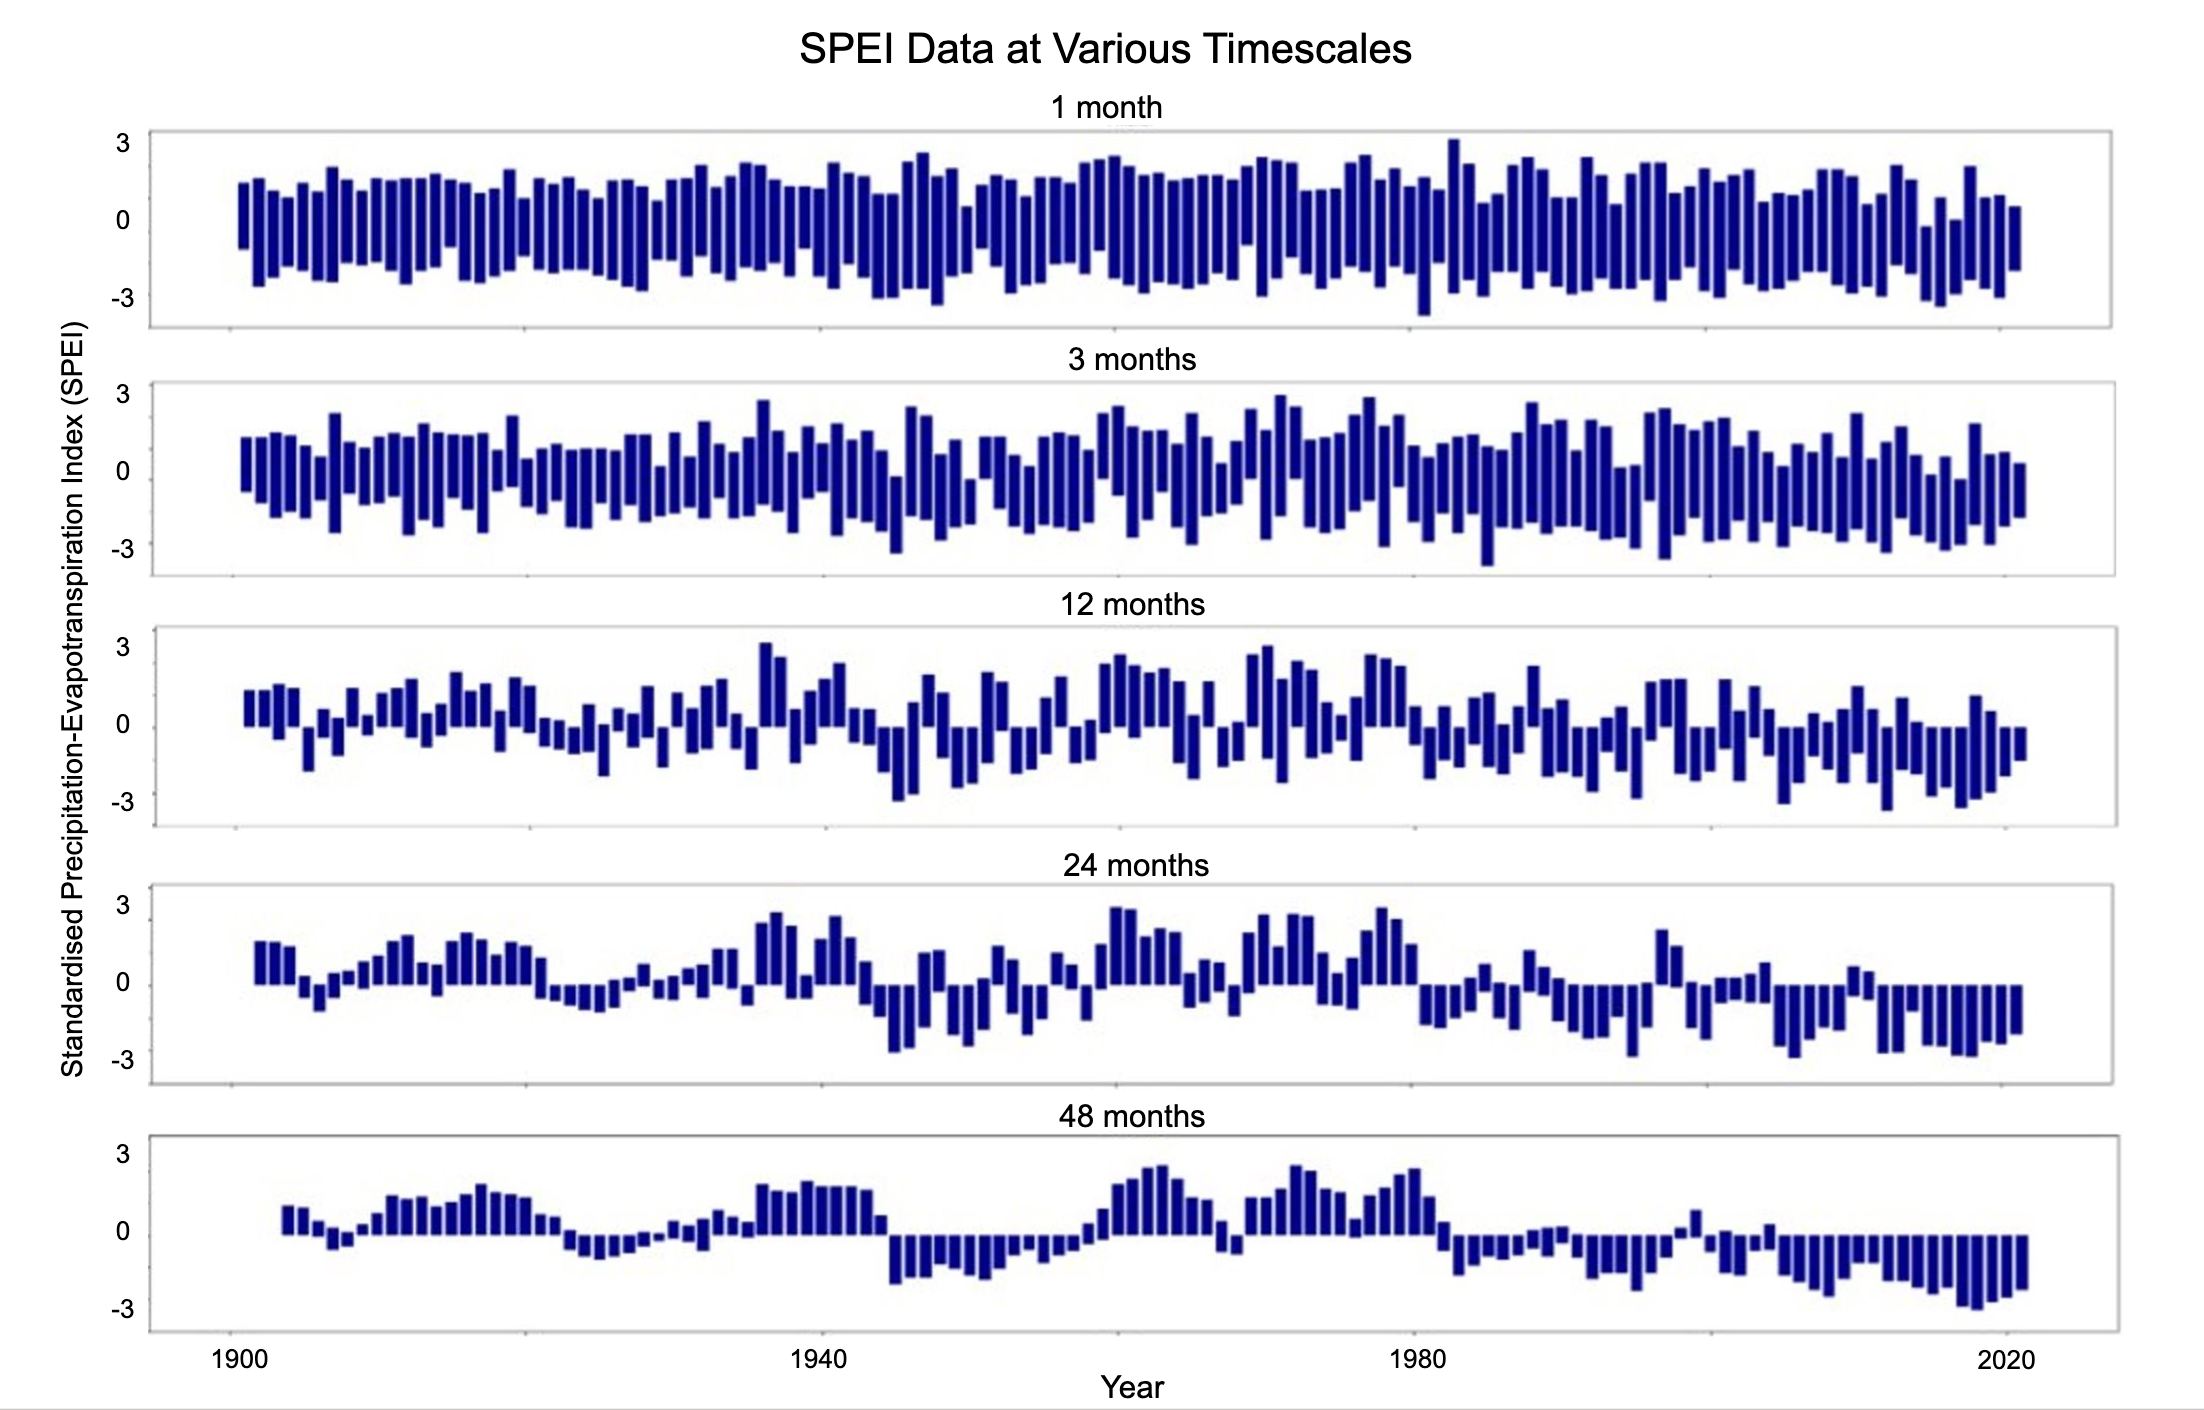
Data Update: Committed to our continuous effort in improving the Sovereign ESG Data Portal, we are replacing the existing source for the Standardised Precipitation-Evapotranspiration Index (SPEI) drought indicator with a new, state-of-the-art dataset with better coverage. Note that the indicator is aggregated to the country level by the Data Portal Team. Furthermore, the SPEI is calculated for 48 different timescales. The ESG data portal contains the 12-month time scale. There are now 206 countries represented with data from 1960-2021.
 Source: World Bank
Drought is a major hydroclimatic hazard, with vast and varied socioeconomic and environmental impacts across the world. From 1970 to 2019, drought affected about 55 million people every year, leading to significant loss of human life with more than 650,000 deaths UNDRR (2023) .
Strategic economic sectors such as food (agriculture and livestock) and energy production (hydropower, wood) are highly vulnerable to drought. For some regions of the world with developing economies and populations highly dependent on the primary sector (i.e. natural resources), the onset of a drought may lead to population crises, migration, hunger and even armed conflicts. In highly developed economies, drought effects may have fewer social implications but enormous economic consequence. The impact to some sectors can cascade to other sectors and increase the prices of a wide range of products. In regions focused on the production of agricultural export, the economic impact of droughts can be devastating, and may affect the agricultural prosperity of the entire region. As a representative number, US crop failures due to drought have caused US$249 billion losses since 1980 UNDRR (2023) .
Despite its crucial importance, drought quantification is quite difficult given the limited and fragmented data on drought impacts and the variety of economic sectors that are affected Changnon Jr. and Easterling (1989) . Moreover, there are different drought types: meteorological, hydrological, agricultural, ecological and socioeconomic, which depend on the type of water resource deficit and the related impacts Wilhite and Glantz (1985) . Given the complexity of drought types and the lack of impact data, drought severity is most often quantified by means of synthetic indices based on widely available meteorological information. This simplifies the problem of drought quantification and allows for objective drought severity assessment, both generally and on different sectors, based on the climatic origin.
Among the several existing meteorological drought indices, the Standardized Precipitation Evapotranspiration Index (SPEI) uses a holistic approach for assessing impacts of drought. SPEI is calculated using data of precipitation and atmospheric evaporative demand [1] , and it can be calculated at different time scales Vicente-Serrano et al. (2022) , Beguería et al. (2014) [2] . These characteristics make the SPEI an ideal candidate to quantify drought severity and assess drought impacts across different sectors.
The SPEI is an established dataset with many use cases
The SPEI has been used to determine impacts on crops Labudová, Labuda and Takáč (2017) , Peña-Gallardo, Vicente-Serrano, Hannaford, et al. (2019) , Bachmair, Kohn and Stahl (2015) , soil moisture Scaini et al. (2015) , streamflow Peña-Gallardo, Vicente-Serrano, Domínguez-Castro, et al. (2019) , forests Gazol et al. (2017) , Khoury and Coomes (2020) , among other impacts; to study recent dynamics and trends of drought at regional Chen and Sun (2015) , Das et al. (2016) , Wang et al. (2016) to global scales Vicente-Serrano, Beguería and López-Moreno (2010) and to assess future drought conditions Spinoni et al. (2020) . Moreover, some studies have shown that the SPEI identifies better drought impacts in a variety of sectors than other indices Tajbakhsh, Eisakhani and Fazl Kazemi (2015) , Vicente-Serrano et al. (2012) . From a socioeconomic perspective, the SPEI has been used to attribute wheat yields to drought severity at national and subnational scales Zampieri et al. (2017) , to determine the effects of drought on soybean and maize production in US Zipper, Qiu and Kucharik (2016) , to assess the vulnerability of African maize yield to drought variability Shi and Tao (2014) , to analyze the drought effects of malnutrition and livelihoods in Mali Jankowska et al. (2012) , and to analyze the economic impact of drought at the global scale Felbermayr et al. (2022) .

SPEI in action: Eastern Africa
One use of the SPEI data has been to uncover regional drought dynamics Chen and Sun (2015) , Das et al. (2016) , Wang et al. (2016) . Investigating the features and impacts of droughts regionally can help neighboring governments and NGOs plan for and coordinate aid. It can also highlight the regions that need assistance most for intergovernmental agencies. For example, researchers used SPEI to highlight the effects of severe droughts in 2004 and 2005 on social cohesion and trust in Eastern Africa De Juan and Hänze (2021) . We can explore those dynamics with the data in the following chart of SPEI data in Africa. Without SPEI data, policymakers relied on water crises, which limited their ability to manage the aid to vulnerable populations in exceptional drought events. In addition to coordinating aid, SPEI data supported better crop and ecological management. Policy and forecasting are improved by SPEIs advances in data analysis techniques. These outcomes help millions around the world to lead safer and more stable lives.
Open this view in the portal.


