Landcover transitions
A country's land cover composition is a helpful starting point for understanding its environmental profile. But the composition itself is often only part of the story. More interesting is often how the land cover changed. In the case of deforestation, for example, we would be interested in the current land cover and how it has changed recently. Did the rate of deforestation decrease? Or did reforest programs successfully expand forest cover?
This tool goes one step further and answers the question: From which type and into which type of land cover did the country transition? Different from country-level aggregates on forest losses, transitions between land cover types also tell us more about the drivers and causes. If forests were cleared for agricultural purposes, we would expect to see transitions from the Tree cover type into Cropland or Grassland. If reforestation efforts were successful, we would expect the reverse.
 Source: World Bank
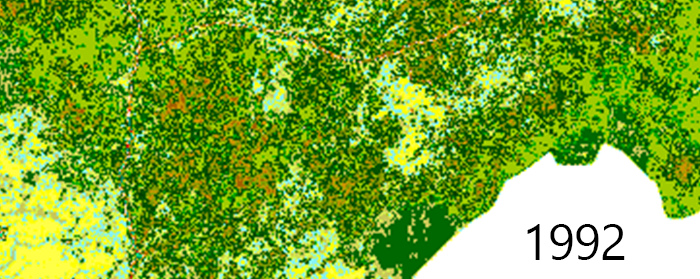
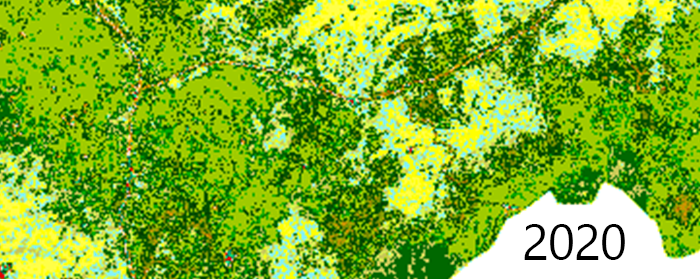
The graphs below show how land cover types changed from year to year, starting with the transition between 1992 to 1993. The original data contains 37 land cover types but for clarity, we only present 12 types. The data is derived from a time series of consistent global land cover maps at 300m spatial resolution annually from the European Space Agency's Climate Change Initiative Land Cover (v2.0.7) project.

Download land cover transitions
Below you can download the transitions you see above for this country or for all countries. Please refer to our data usage policies in the FAQ .
Download this country (csv) Download all countries (csv)Land cover classes
For more details, see the website of the European Space Agency's Climate Change Initiative Land Cover (v2.0.7).
| Color | Group | Description |
|---|---|---|
| missing | No Data | |
| cropland | Cropland, rainfed | |
| herbaceous | Herbaceous cover | |
| mixed | Tree or shrub cover | |
| cropland | Cropland, irrigated or post‐flooding | |
| cropland | Mosaic cropland (>50%) / natural vegetation (tree, shrub, herbaceous cover) (<50%) | |
| mixed | Mosaic natural vegetation (tree, shrub, herbaceous cover) (>50%) / cropland (<50%) | |
| tree | Tree cover, broadleaved, evergreen, closed to open (>15%) | |
| tree | Tree cover, broadleaved, deciduous, closed to open (>15%) | |
| tree | Tree cover, broadleaved, deciduous, closed (>40%) | |
| tree | Tree cover, broadleaved, deciduous, open (15‐40%) | |
| tree | Tree cover, needleleaved, evergreen, closed to open (>15%) | |
| tree | Tree cover, needleleaved, evergreen, closed (>40%) | |
| tree | Tree cover, needleleaved, evergreen, open (15‐40%) | |
| tree | Tree cover, needleleaved, deciduous, closed to open (>15%) | |
| tree | Tree cover, needleleaved, deciduous, closed (>40%) | |
| tree | Tree cover, needleleaved, deciduous, open (15‐40%) | |
| tree | Tree cover, mixed leaf type (broadleaved and needleleaved) | |
| tree | Mosaic tree and shrub (>50%) / herbaceous cover (<50%) | |
| herbaceous | Mosaic herbaceous cover (>50%) / tree and shrub (<50%) | |
| shrubland | Shrubland | |
| shrubland | Evergreen shrubland | |
| shrubland | Deciduous shrubland | |
| grassland | Grassland | |
| other | Lichens and mosses | |
| other | Sparse vegetation (tree, shrub, herbaceous cover) (<15%) | |
| other | Sparse shrub (<15%) | |
| other | Sparse herbaceous cover (<15%) | |
| other | Tree cover, flooded, fresh or brakish water | |
| other | Tree cover, flooded, saline water | |
| other | Shrub or herbaceous cover, flooded, fresh/saline/brakish water | |
| urban | Urban areas | |
| bare | Bare areas | |
| bare | Consolidated bare areas | |
| bare | Unconsolidated bare areas | |
| water | Water bodies | |
| snow and ice | Permanent snow and ice |