Country Profile

Key statistics
Sovereign ESG profile
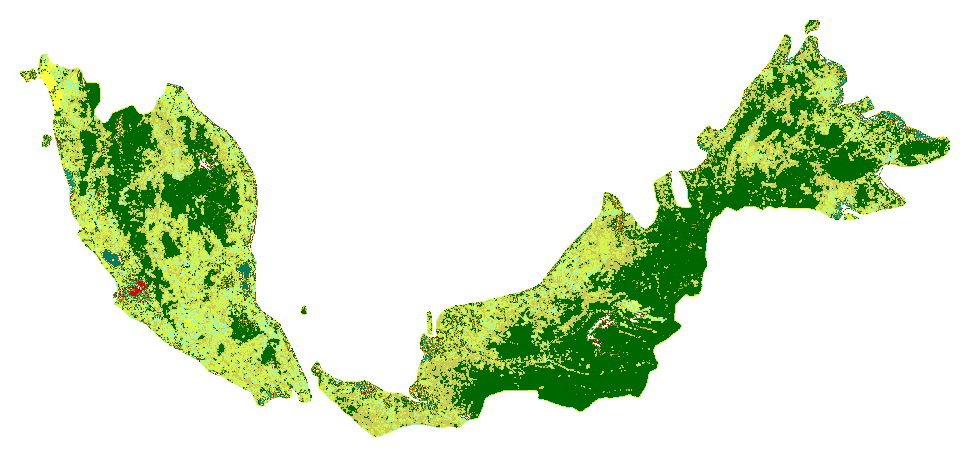
Land cover profile
Wealth accounting profile
Wealth accounting provides an estimate of the total wealth of nations by aggregating values of these different components of wealth. Change in wealth per capita is an indicator to assess a country’s potential to grow in the future. A fall in wealth indicates that a country is depleting its assets and may not be able to sustain its future GDP growth. Read more
Peer countries
To better understand a country's profile, it is useful to understand it in the context of other comparable countries. Which countries form the set of so-called peer countries can vary depending on the purpose of the comparison. Often we can find peer countries based on common income classifications, geographic regions, or climate profiles. See the FAQ for more details.